What’s new
The IBM Design Language guidance, assets, and site experience are constantly evolving and improving. This page lists all major updates, changes, rollouts and release dates. Check back here to learn what’s new in the latest release.
Hybrid UI illustration style
Hybrid UI illustrations are the offspring of user interface design and conceptual illustration. They inherit visual qualities from both, making them a great fit for marketing hardware and software products, offerings and services. They feel at home on the same page with product screenshots and illustrations of abstract concepts alike. This versatile style can be used in many ways, for example, to depict complex or abstract ideas, outline relationships, convey workflows and more. These approachable illustrations help explain complicated scenarios and technical concepts about products in a simple and clear way. Find guidance and download the hybrid UI illustration kit on the IBM Design Language Illustration page for Hybrid UI style.
—
10 April, 2024
Technical diagrams
Technical diagrams are used throughout IBM. Their thoughtful arrangement, using a wide variety of elements, helps us deliver information with clarity. Based on the IBM Design Language and Carbon Design System, our technical diagrams might describe an IT architecture, show a structural hierarchy or outline the order of a process flow. Beyond the fundamentals for all technical diagrams, the IT architecture subsystem is dedicated to the vizualization of the IBM Unified Method Framework for IT architecture concepts. The product documentation subsystem covers flows, process diagrams and so on. You’ll find useful, clear and descriptive guidance for Design and Usage on our new Technical diagrams pages.
—
15 June, 2022
Infograms
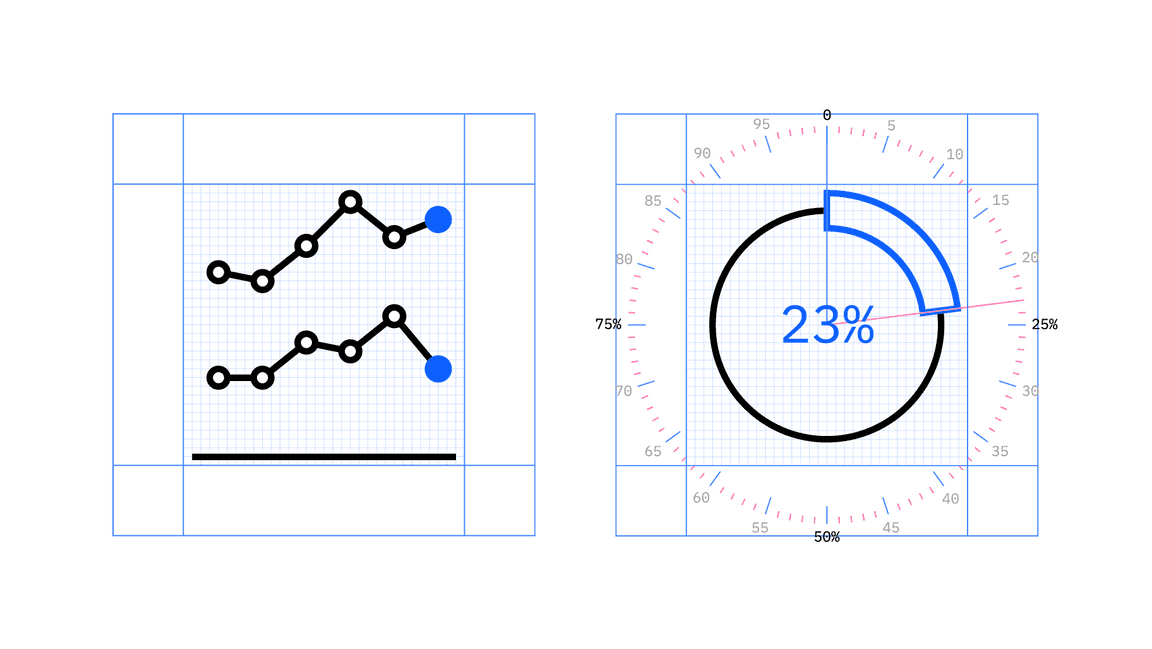
Infograms are information graphics that mimic the style of IBM pictograms. But unlike the charts found in the IBM pictogram library that illustrate the idea of data visualization, infograms depict real data. Adapted for use in small spaces, the infogram works well as tertiary or marginal data. Stylistically, the infogram pairs with productive pictograms in visual harmony. Discover more about the six types of infograms and how each one provides instant visual comprehension of the data represented on the Infograms page.
—
15 June, 2022
People illustration
Humanity is integral to our work. It fosters insights we use to bring people and technologies together that create outcomes larger than we could ever accomplish alone. We celebrate humanity’s vast diversity—of personalities, cultures and abilities—through inclusive illustration guidance that features an established aesthetic that’s identifiably IBM. Check out our People page, where you’ll find a distinct color palette for representing skin tones, precise geometry for realistic proportions, useful tips for creating portraits and more.
—
25 May, 2022
IBM Plex® Sans Japanese
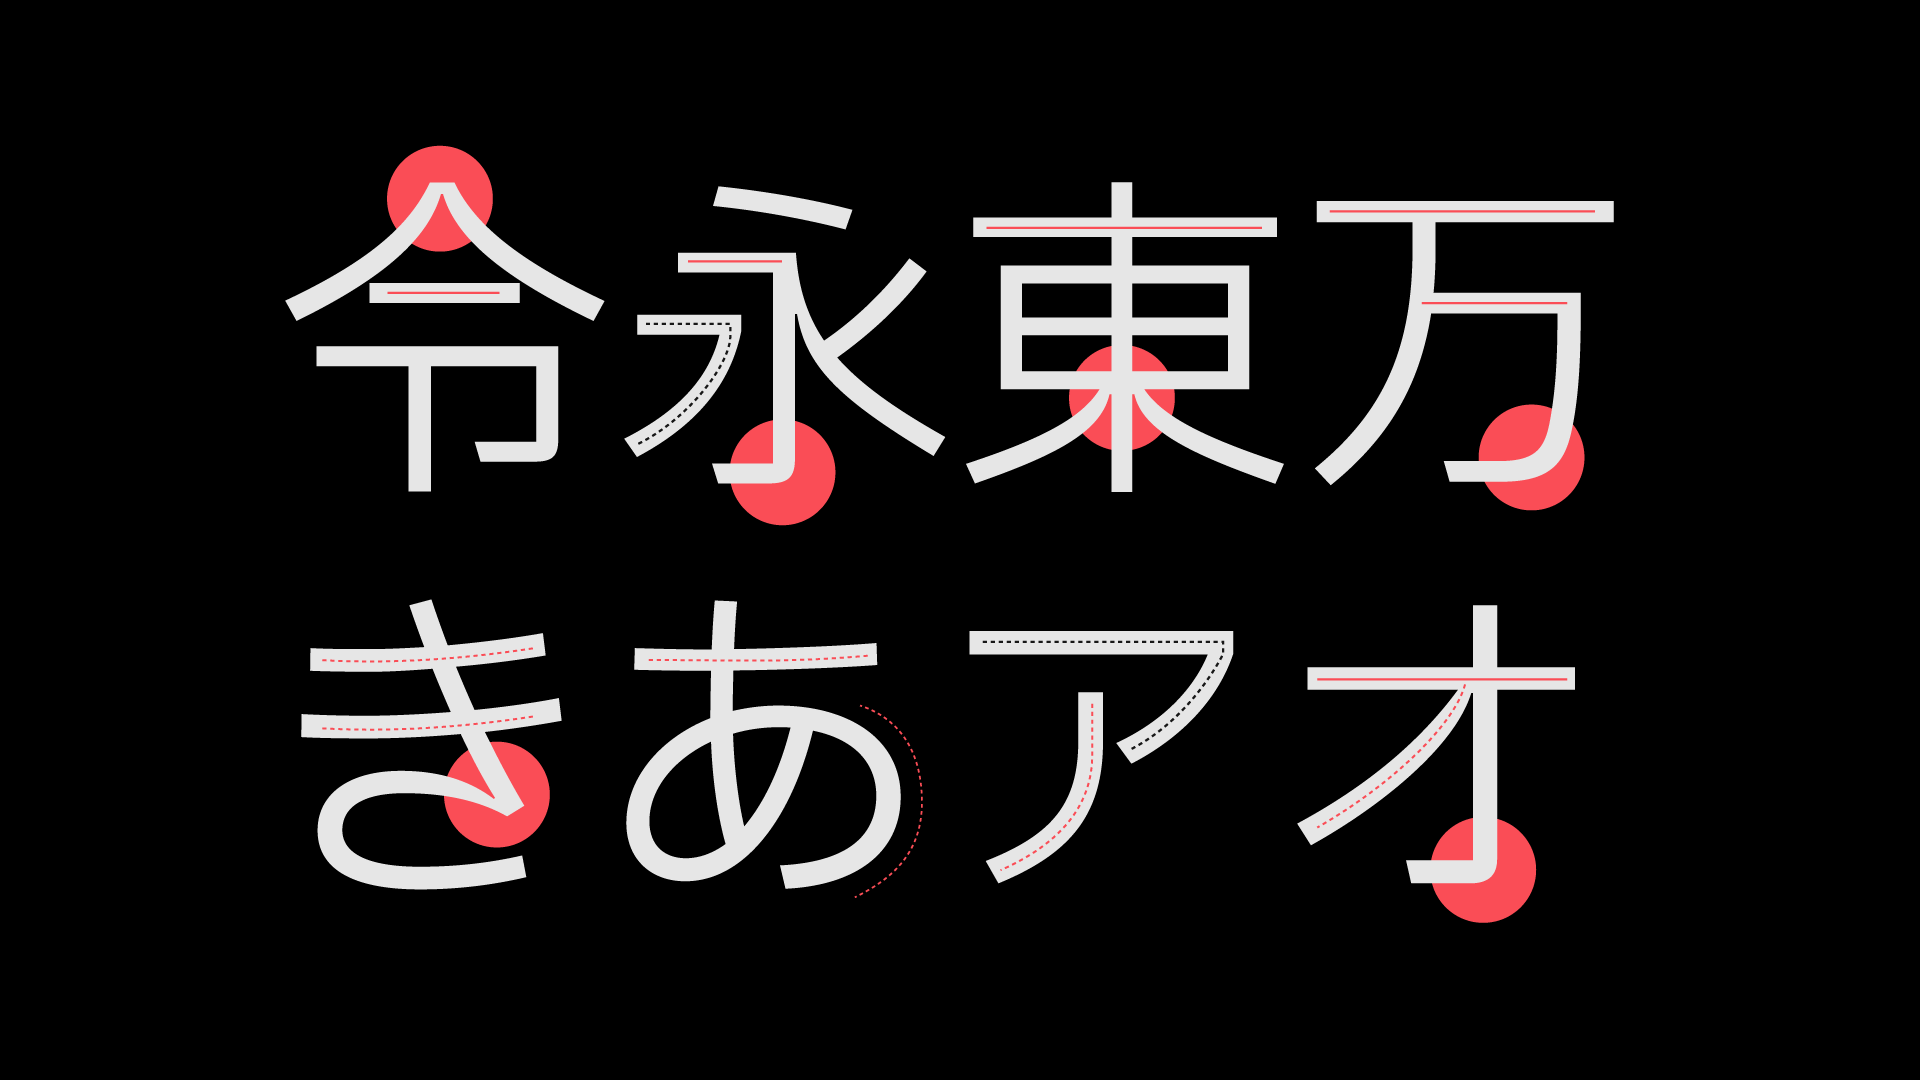
After two years of design and development, our custom-designed typeface, IBM Plex®, is now available in Japanese. IBM Plex Sans JP makes a fine addition to our non-Latin families and will continue to make IBM communications distinctive across all experiences in over 100 languages worldwide. Open source and free to use, Plex® also comes in Arabic, Cyrillic, Devanagari, Greek, Hebrew, Korean, and Thai. Learn more on how to use the Plex typeface family (w3id required) and download IBM Plex Sans JP here.
—
30 July, 2021


