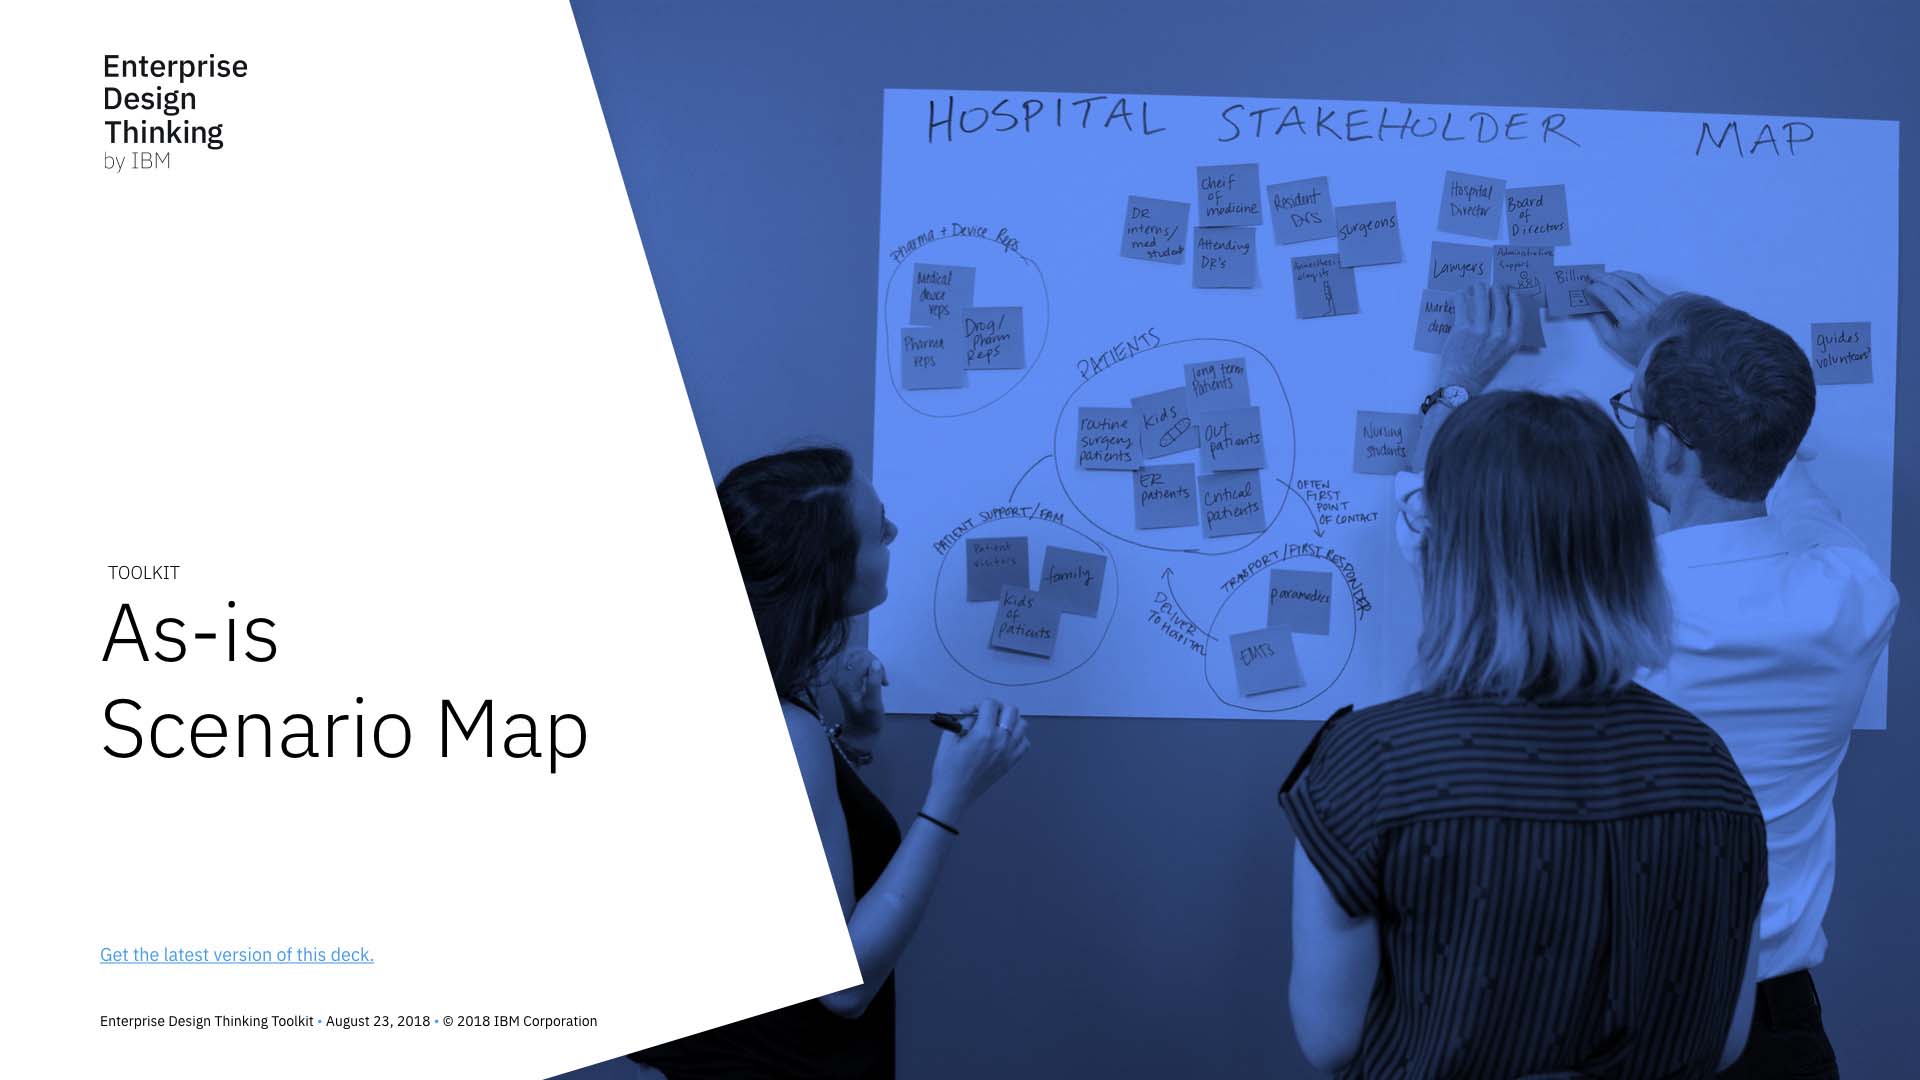
As-is Scenario Map
Build a better understanding of your users’ current experience.
When you might use this
As-is Scenario Maps help to document collective understanding of user workflows and are best used as precursors to exploring new ideas or for finding the right problem to solve.
Step-by-step


Instructions
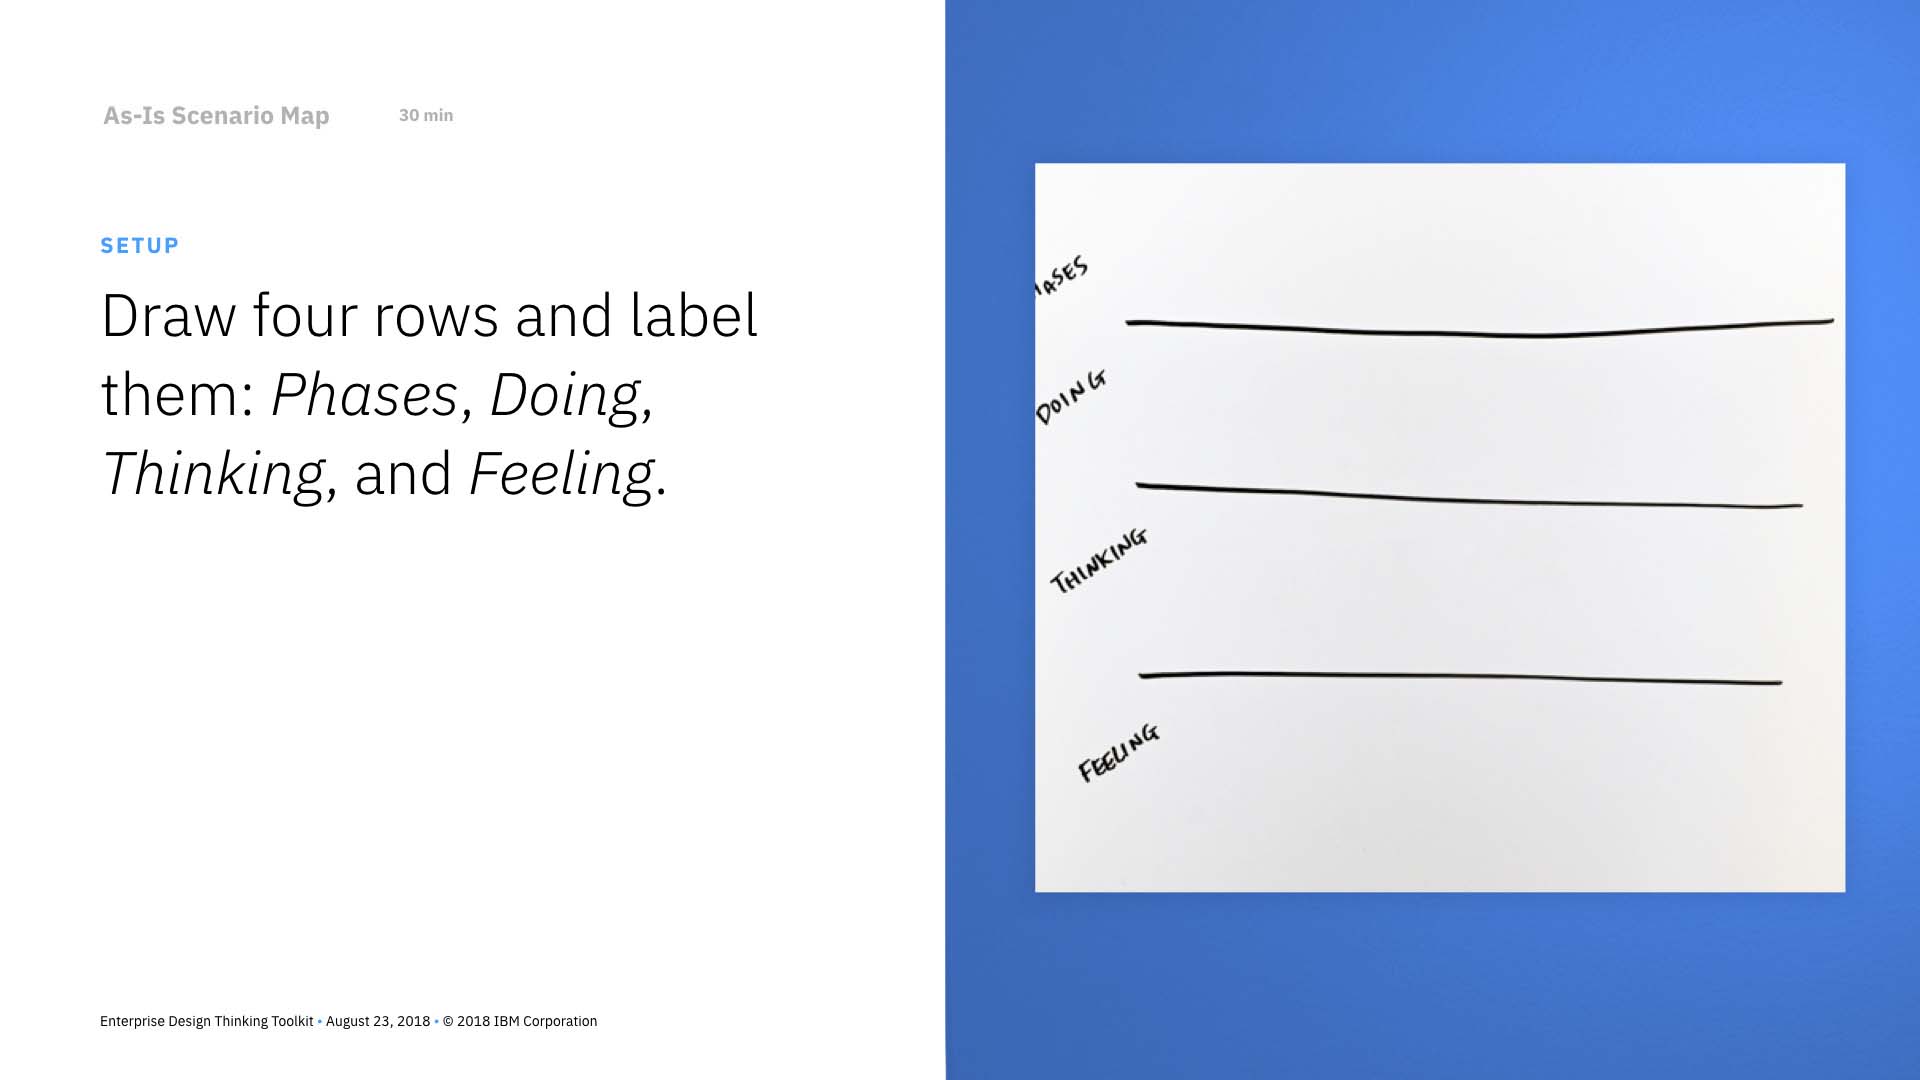
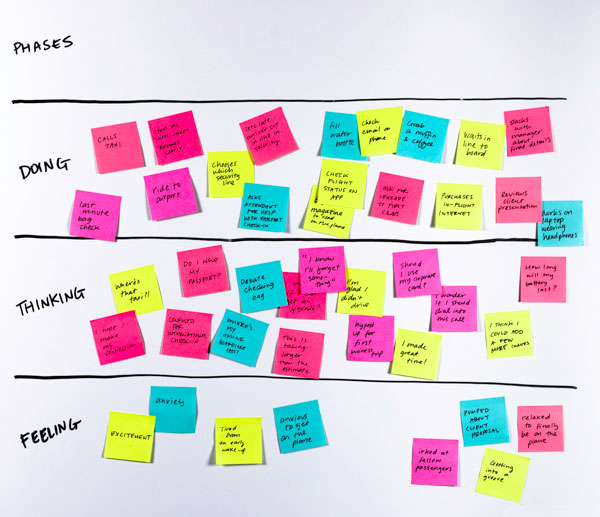
1. Set up the activity
Draw four rows and label each: Phases, Doing, Thinking, and Feeling.

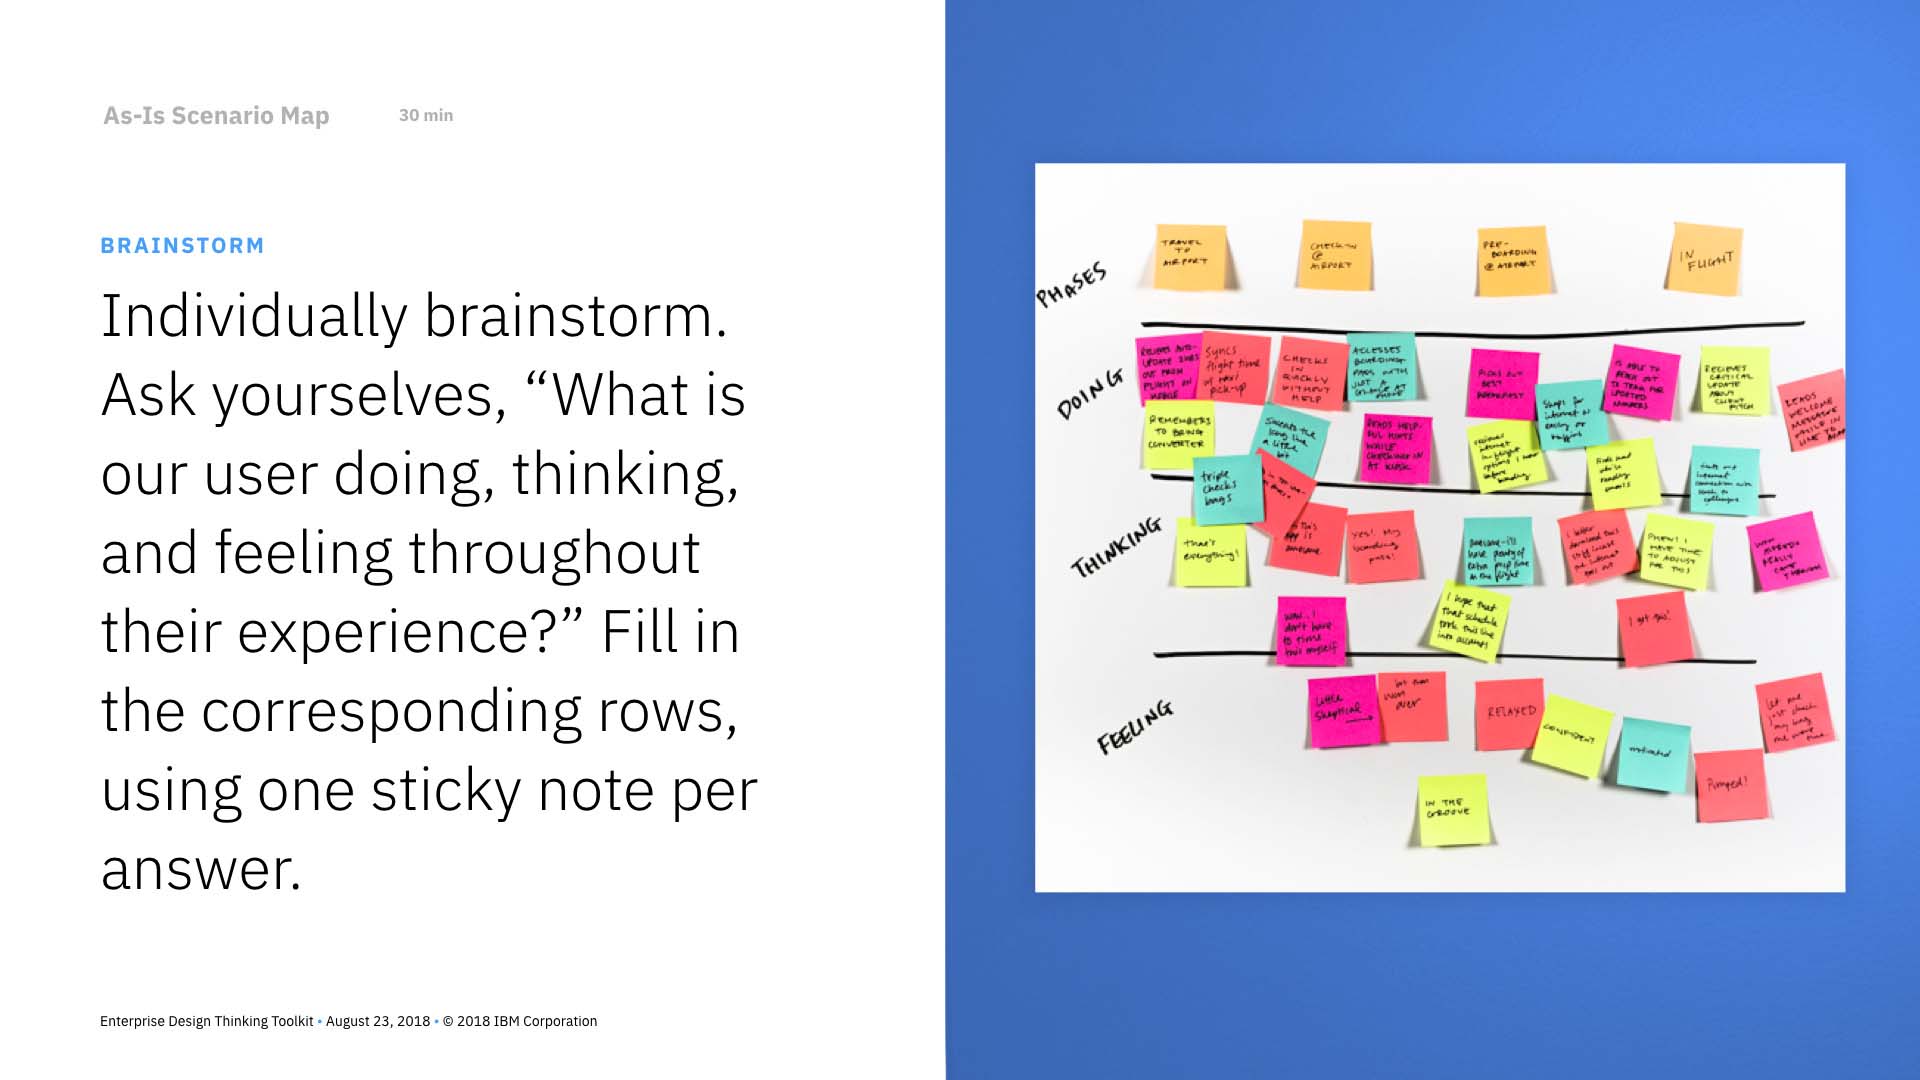
2. Brainstorm individually
Ask yourselves: “What is our user doing, thinking, and feeling throughout their experience?” Fill in the corresponding rows, using one sticky per answer.
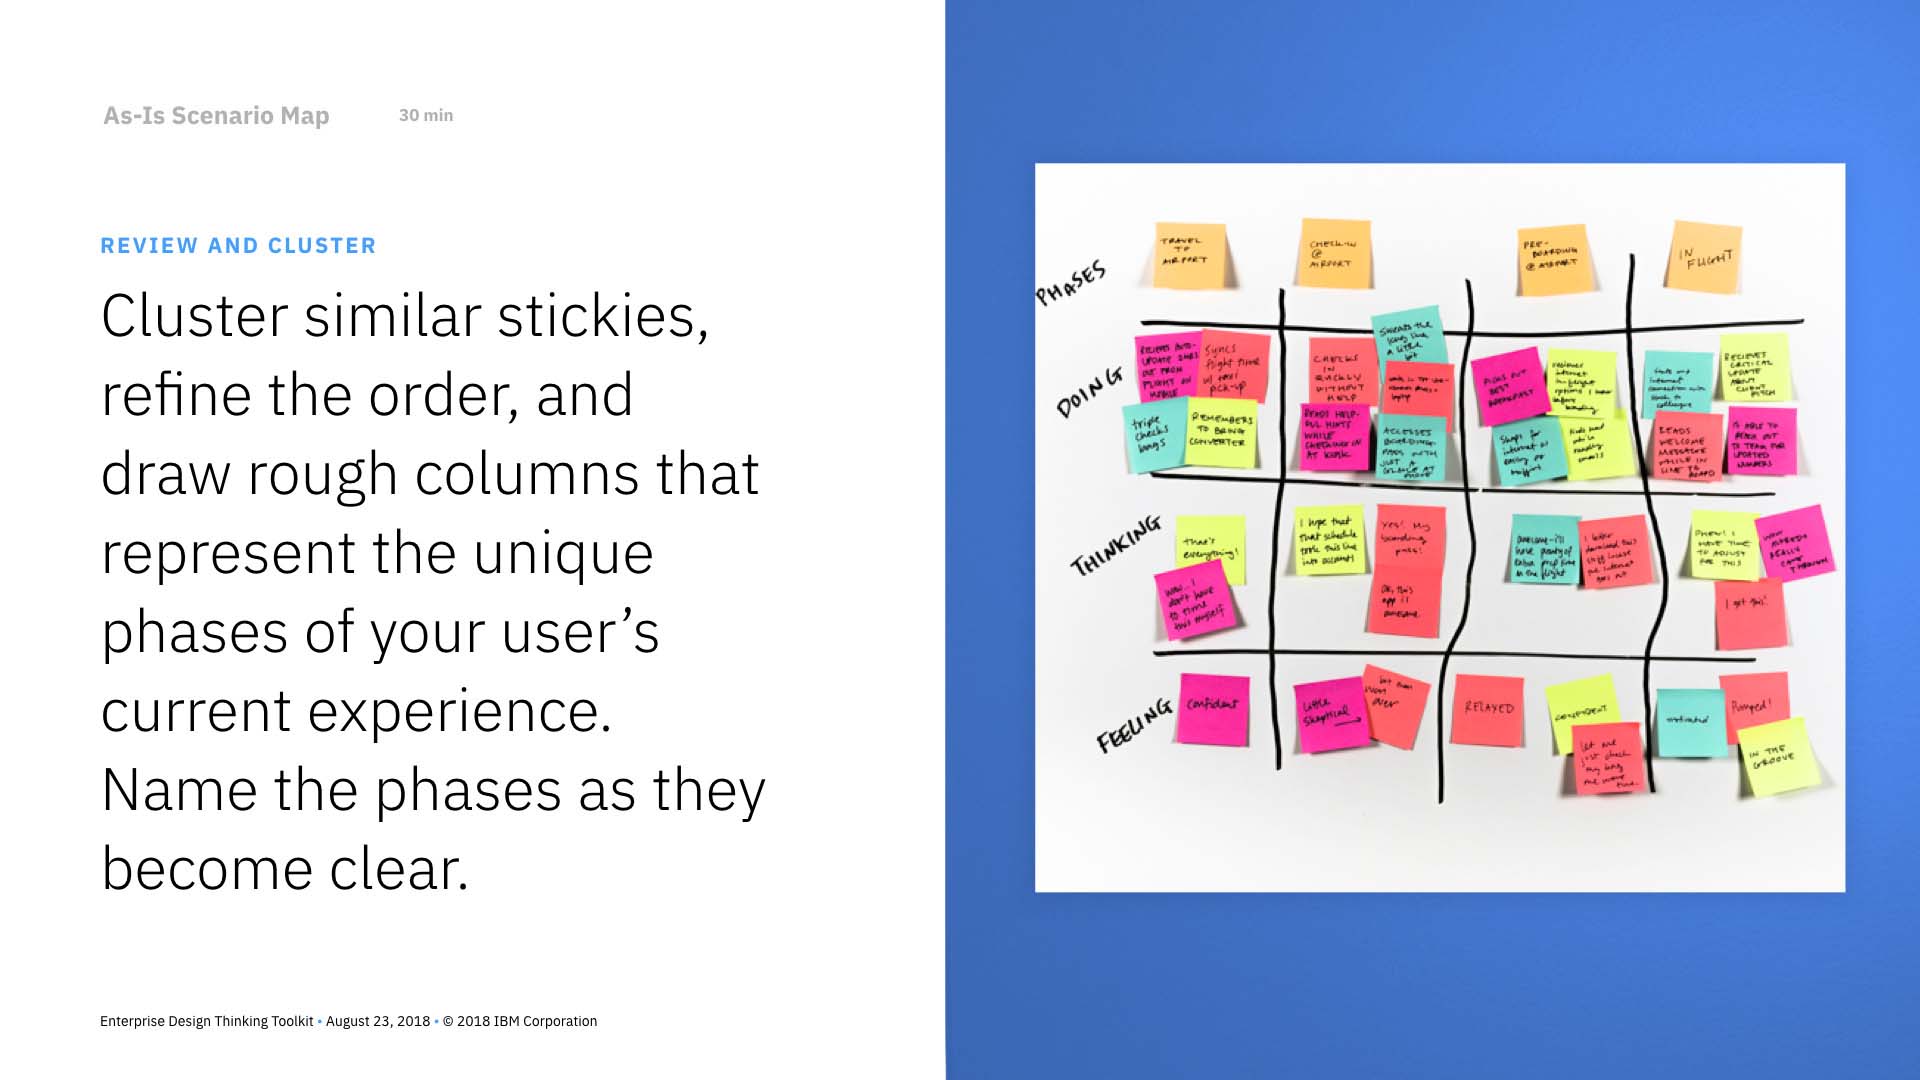
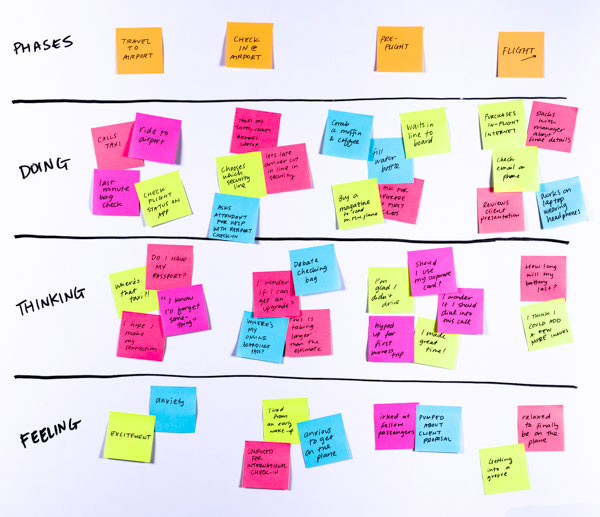
3. Review and identify phases
Use this time to cluster similar stickies, refine the order, and draw rough columns that represent the unique phases of your user’s current experience. Be sure to name the phases.
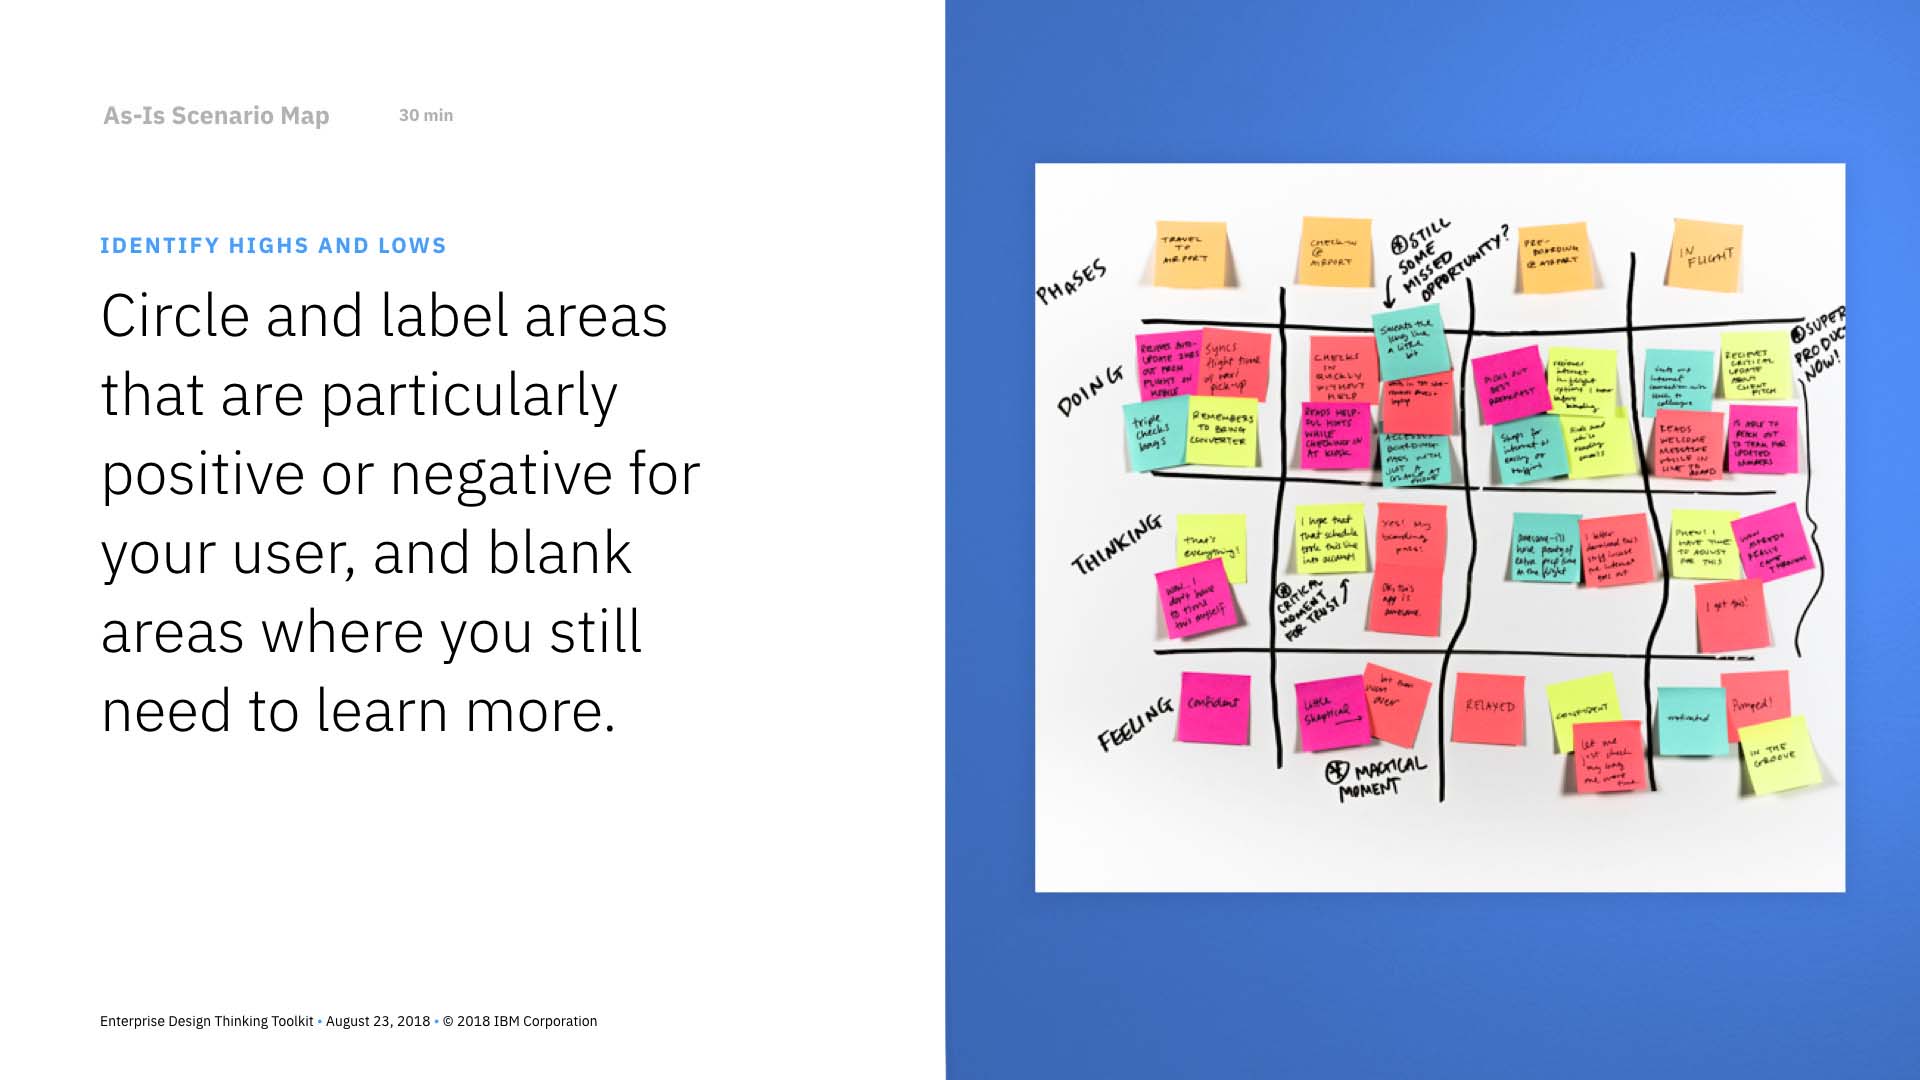
4. Identify the highs and lows
Circle and label areas that are particularly positive or negative for your user, as well as blank areas where you need to learn more.

Pro-tips
Watch Colin Budd, Enterprise Design Thinking Coach, share practical tips about As-is Scenario Maps.