News
Abstract
The following updates are available in release 2.0.83 SC of Planning Analytics.
Content
The following feature notices apply to Planning Analytics Workspace.
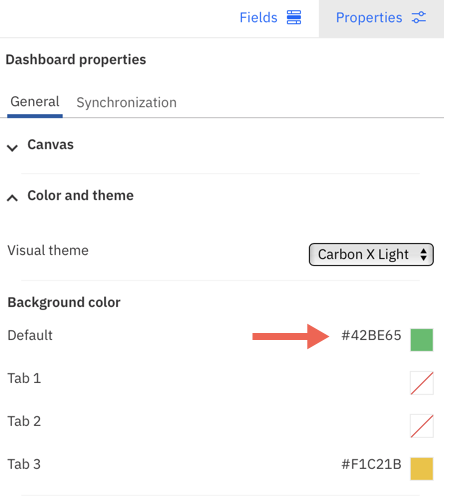
Set default background color for tabs
You can now set a default background color for all tabs in a book. When you set a default background color, the same background color is used for any new tab that you add to the book. All existing tabs also use the default background color provided they do not have their own color settings.
To set a default background color for tabs:
- Click Properties.
- For the entire book, ensure that nothing else has focus by clicking the background, away from any visualization or object.
- Click Color and theme, and under Background color select a default color.
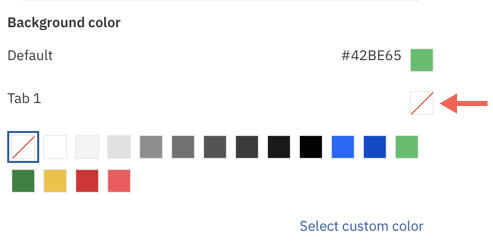
Tip: You can also click Select custom color to open the color picker instead of choosing from the default color options.
You can override the default background color for an individual tab by selecting a new color for the tab.
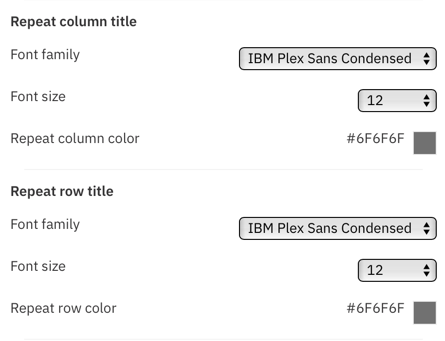
You can now customize repeat column and repeat row titles in visualizations that use Repeat (column) or Repeat (row) filters. Formatting properties for repeat column and repeat row titles appear in their own sections under Axis in Properties.
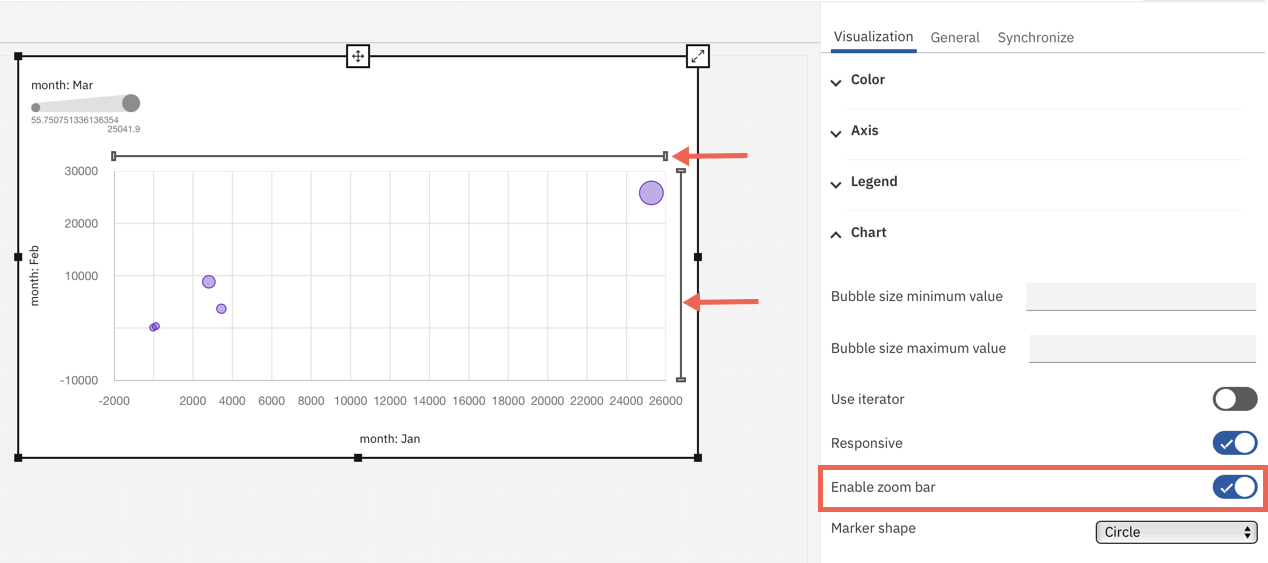
Enable zoom bar
The zoom bar allows for horizontal and vertical scrolling in bubble and scatter visualizations. You can now enable the zoom bar in bubble and scatter visualizations to scroll and focus on a smaller area of the visualization.
Use the Enable zoom bar property to add the zoom bar to your visualization. Drag a handle on the bar to zoom and focus on an area in the visualization. The area of focus changes as you drag the handle.
Bubble size limits
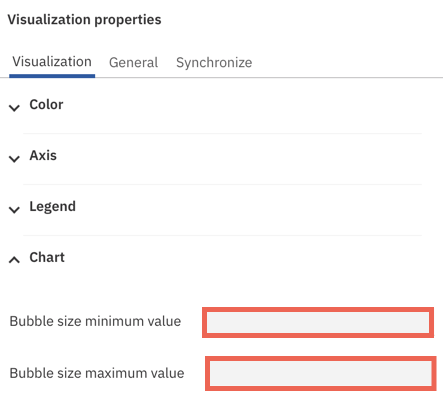
You can specify bubble size limits in bubble and scatter visualizations in the Chart section under Properties.
In bubble visualizations, you can specify the minimum and maximum values for the bubble size. Bubbles for values that are less than the minimum size appear as the minimum size, while bubbles for values that are more than the maximum size appear as the maximum size.
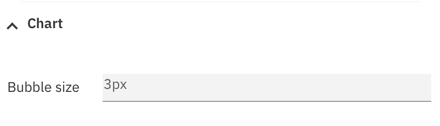
When you specify a bubble size in a scatter visualization, all points in the visualization display at this specified size. The default bubble size in scatter visualizations is 3px.
Show item value and axis value grid lines
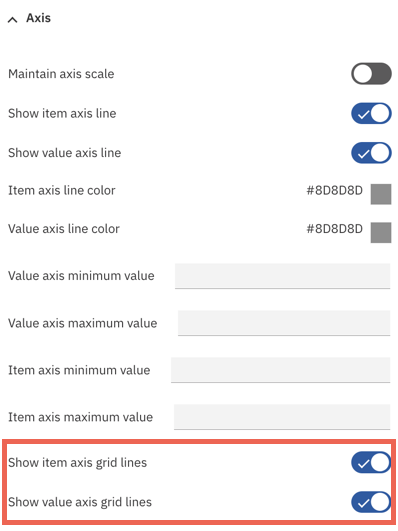
Two new properties, Show item value grid lines and Show item value grid lines, replaced the Show grid lines property in bubble and scatter visualizations. These new properties now let you show or hide item value and axis value grid lines independently of each other.
You can find Show item value grid lines and Show item value grid lines in the Axis section under Properties.
New properties in line and column visualization
In IBM® Planning Analytics Workspace 2.0.83, the following new properties were added in the line and column visualization:
Enable zoom bar
The zoom bar allows for horizontal scrolling in a line and column visualization. You can now enable the zoom bar to scroll and focus on a smaller area of the visualization.
Use the Enable zoom bar property in the Chart section under Properties to add the zoom bar to your visualization. Drag a handle on the bar to zoom and focus on an area in the visualization. The area of focus changes as you drag the handle.
Formatting options for column value and point value labels
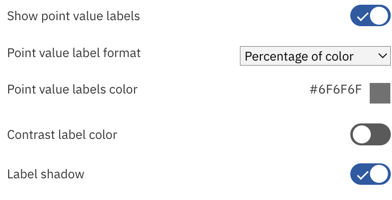
You can format column value labels and point value labels in line and column visualizations. Value labels can now display as values or percentages of a category or color.
To change the format of value labels, enable Show column value labels or Show point value labels in the Chart section under visualization properties.
New properties were also introduced for point value labels. You can add a shadow to the labels, change their color, or set a contrast label color.
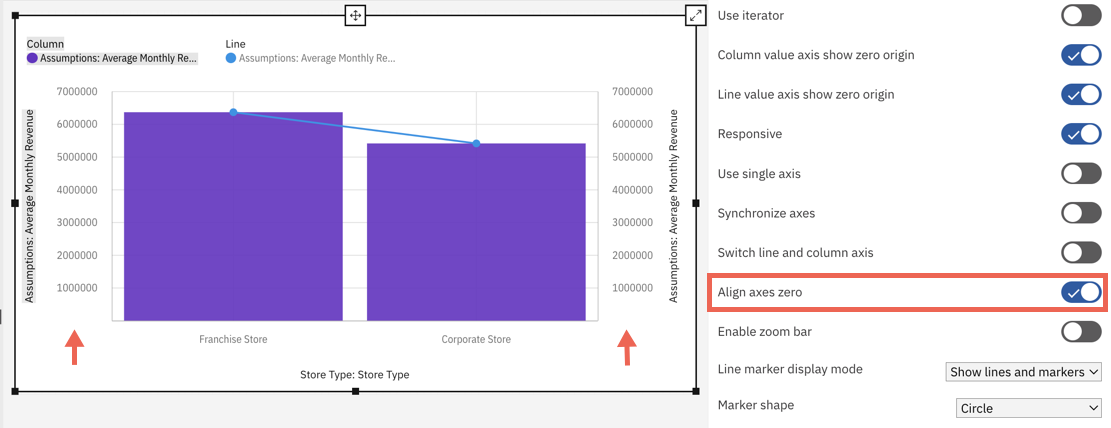
Alignment position for zero
In line and column visualizations, you can control whether the line and column sections have zero in the same position with the new Align axes zero property.
Found under the Chart section in visualization properties, the Align axes zero toggle is enabled by default. If the toggle is enabled, the zero values for the lines and columns are on the same axes in the visualization. If the toggle is disabled, the zero value might be on different axes in the visualization.
Disabling the zero alignment position (that is, specifying that the line and column sections do not have zero in the same position) makes the line and column values independent and can make the relevant values more visible in certain scenarios.
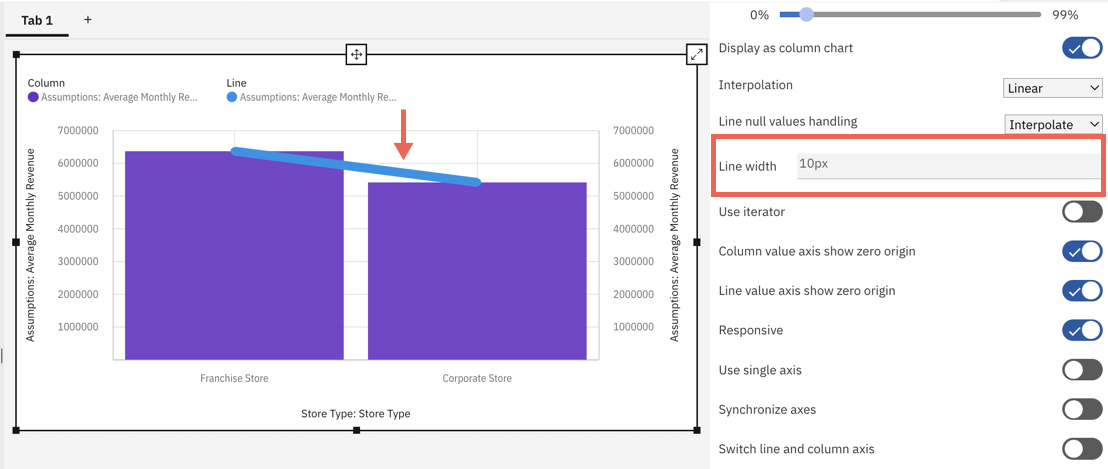
Change line width
You can now change the line width in line and column visualizations by specifying the thickness of the line. By default, the line width is set to 2 px.
Classic dimension editor to be removed from the modeling workbench in Planning Analytics Workspace 2.0.84
As of Planning Analytics Workspace 2.0.84, the classic dimension editor will be removed from the modeling workbench. The classic dimension editor remains available on books.
All dimension creation and maintenance in the modeling workbench must be performed in the new experience dimension editor. The new experience dimension editor was introduced on the modeling workbench in Planning Analytics Workspace 2.0.82.
Was this topic helpful?
Document Information
Modified date:
16 January 2023
UID
ibm16854727