Troubleshooting
Problem
Symptom
Cause
Environment
Diagnosing The Problem
To diagnose the problem, the server must be started with the following JVM argument in place. To set the JVM parameter on WebSphere Application Server, refer to Setting generic JVM arguments in WebSphere Application Server. This setting can be left in place without any performance degradation as this is enabled by default starting in 6.0.3.
-Dcom.ibm.team.repository.service.internal.vvc.enableCounters=true
For Tomcat or WebSphere Liberty, the argument can be applied by adding the following line in the JVM arguments section in the startup script.
set JAVA_OPTS=%JAVA_OPTS% -Dcom.ibm.team.repository.service.internal.vvc.enableCounters=truehttps://<server>:<port>/rm/service/com.ibm.team.repository.service.internal.counters.ICounterContentService/
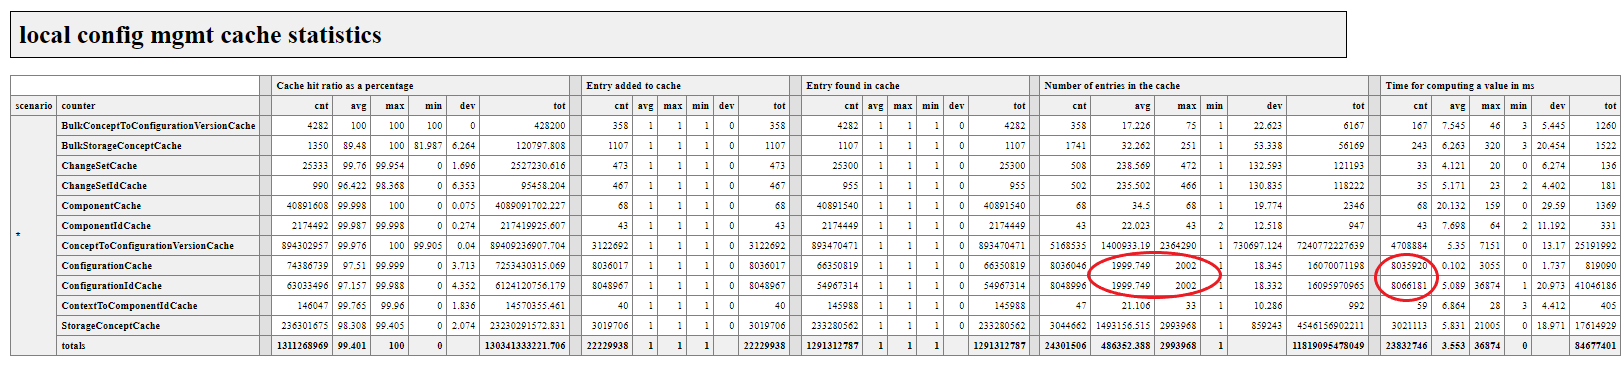
Search for the section called "Local Configuration Management Cache Statistics".
Cache limits vary based on the release being used, so caution must be taken when tuning the cache in order to ensure that proper tuning is being applied. Red flags to look for on any row in the table include "
cnt" values that are higher than the current cache limits, especially when "avg"/"max" values closely match the current cache limits. Example: In this example (taken from a 6.0.6.1 server), the ConfigurationCache "
cnt" exceeds 8M while the "avg"/"max" is only 2000. This indicates a high level of cache turnover, as the cache is only able to handle 2000 values (default for 6.0.4 and beyond). It is important to note that the total count of active configurations does not align with the 8M "cnt" value observed; the SQL query that is given can be used to determine the total number of active configurations.Local Configuration Management Cache Statistics Table
If a red flag is found, run this SQL query against the database:
Number of Active (non-archived) configurations in the Repository:
For SQL Server & DB2:
DOORS Next 6.x:SELECT COUNT(*) FROM VVCMODEL.CONFIGURATION WHERE ARCHIVED = 0;
For Oracle:
For DOORS Next 6.x, use:
SELECT COUNT(*) FROM VVCMODEL_CONFIGURATION WHERE ARCHIVED = 0;
If the result of the SQL query exceeds the default values that are found in this table (or any existing cache values set in your environment), cache tuning is required.

Resolving The Problem
If the result exceeds the defaults in the table Local Configuration Management Cache Statistics, set the values in the JVM settings that are detailed here to at least the current number of configurations returned by the Number of Active (non-archived) configurations in the Repository query - but see the JVM Heap Note for changes that might be needed to JVM heap size, and how to work with IBM support if numbers greater than 5000 are indicated.
-Dcom.ibm.rdm.configcache.expiration=4320

-Dcom.ibm.rdm.configcache.size={# of configs from query}

-Dcom.ibm.team.repository.service.internal.vvc.noOfConfigsToCache={# of configs from query}

-Dcom.ibm.team.repository.service.internal.vvc.ConfigurationIdCache.noOfConfigsToCache={# of configs from query}

-Dcom.ibm.team.repository.service.internal.vvc.noOfComponentsToCache=2000

-Dcom.ibm.team.repository.service.internal.vvc.noOfContextsToCache=2000Each cache entry consumes approximately 2 MB of JVM heap. As a result, it is not recommended to set or increase cache tuning to values to greater than 5000 without explicit recommendation from IBM Support. It is also recommended that customers monitor JVM heap usage after setting any non-default cache tuning in their environment, as the current heap values may no longer be sufficient after increasing cache sizes.
Was this topic helpful?
Document Information
Modified date:
29 June 2022
UID
swg21995500