Troubleshooting
Problem
Most IBM Power Systems have one or more amber Attention LEDs or indicators. These help alert the user when the system encounters a problem and needs attention. They can also help identify which component in the system is reporting a problem.
This document is intended to help users identify and resolve the cause of an Attention LED or indicator being lit or shown.
Symptom

Figure 1: Example of a physical system Attention LED.
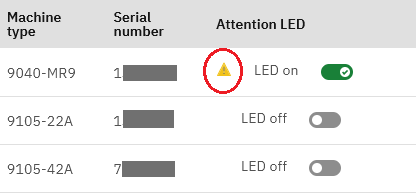
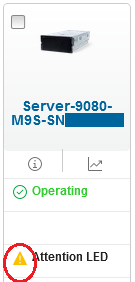
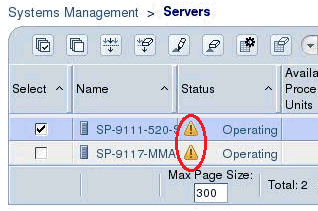
Figure 2: Examples of an Attention indicator in three versions of the HMC GUI.
Cause
When you see one of these examples, it most likely means one or more of the following occurred:
- The system firmware logged a System Reference Code (SRC).
- An AIX or VIOS LPAR reported a Service Request Number (SRN).
- An IBM i LPAR reported a System Reference Code (SRC).
These events can be caused by hardware faults, software problems, environmental problems, configuration problems, or user error. On systems managed by an HMC (Hardware Management Console), these events appear as Serviceable Events. In AIX and VIOS, these events appear in the Error Report (errpt) and the Diagnostic Log as hardware events for the device reporting the problem. In IBM i, these events appear in the Product Activity Log (PAL) and Service Action Log (SAL) for the resource name reporting the problem.
Diagnosing The Problem
To find the cause of the attention LED being lit, review recent events reported by the system:
- HMC
- Carbon GUI (HMC V10R2 and newer)
- In the navigation area, click System resources > Systems.
- Select the server name that shows its Attention LED is on.
- In the blue menu bar that appears, click Service > Manage serviceable events.
- In the Serviceable events window, problems reported by or for the managed system are listed. To see documentation on what an event means, click the SRC or SRN in the Reference Code column. To view details about this specific event, select the row for that event, click Actions > View Details. If the event was reported by a partition, scroll down to the Partition ID, Partition name, and Partition host name fields to see which one.
- Resolve the problem reported. If the problem was reported by an LPAR, you might need to log in to the OS running in that LPAR to perform further troubleshooting. See the VIOS, AIX, Linux, and IBM i sections for details. If hardware service or replacement is needed, or you do not understand the event or what actions are needed, contact support for assistance.
- When a problem is resolved, select the row for that event, click Actions > Close Event. For documentation purposes, optionally enter your name and a description of why you are closing the event. Then click OK.
- Enhanced+ GUI (HMC V8R8.4.0 - V10R1)
- In the navigation area, click Resources > Systems.
- Select the server name that shows its Attention LED on.
- Click Actions > Serviceable Events Manager.
- In the Serviceable events window, problems reported by or for the managed system are listed. To see documentation on what an event means, click the value in the Reference Code column. To view details about this specific event, select the row for that event, click Actions > View Details. If the event was reported by an LPAR, scroll down to the Partition ID, Partition name, and Partition host name fields to see which one.
- Resolve the problem reported. If the problem was reported by an LPAR, you might need to log in to the OS running in that LPAR to perform further troubleshooting. See the VIOS, AIX, Linux, and IBM i sections for details. If hardware service or replacement is needed, or you do not understand the event or what actions are needed, contact support for assistance.
- When a problem is resolved, select the row for that event, click Actions > Close Event. For documentation purposes, optionally enter your name and a description of why you are closing the event. Then click OK.
- Classic GUI (HMC V7 - V8R8.6.0)
- In the navigation area, expand Systems Management and choose Servers.
- Select the system with the attention symbol (
 ) shown.
 - In the Tasks area, expand the Serviceability group and choose Manage Serviceable Events.
- In the dialog window, click OK to accept the default search options.
- In the Manage Serviceable Events window, problems reported by or for the managed system are listed. To see documentation on what an event means, click the value in the Reference Code column. To view details about this specific event, select the row for that event, click Selected > View Details. If the event was reported by an LPAR, scroll down to the Partition ID, Partition name, and Partition host name fields to see which one.
- Resolve the problem reported. If the problem was reported by an LPAR, you might need to log in to the OS running in that LPAR to perform further troubleshooting. See the VIOS, AIX, Linux, and IBM i sections for details. If hardware service or replacement is needed, or you do not understand the event or what actions are needed, contact support for assistance.
- When a problem is resolved, select the row for that event, click Selected > Close Event. For documentation purposes, optionally enter your name and a description of why you are closing the event. Then click Close Events.
- Carbon GUI (HMC V10R2 and newer)
- VIOS
- Log in as padmin.
- Enter diagmenu at the command prompt and press Enter.
- At the Operating Instructions screen, press Enter to continue.
- At the Function Selection menu, choose Task Selection.
- At the Task Selection menu, scroll down choose Display Previous Diagnostic Results.
- Use either the Display Previous Results or Display Diagnostics Summary tasks to view previously reported events. Follow the recommended actions to resolve each problem reported. If hardware service or replacement is needed, or you do not understand the event or what actions are needed, contact support for assistance. (Note: The "sysplanar0" device name refers to the entire system, not a system planar. All events for power, cooling, processors, memory, system bus, system firmware, and environmental issues are reported under this device name. If the system is managed by an HMC, use the HMC to resolve these problems. Closing the related Serviceable Event for a system event on the HMC automatically logs a repair action for the sysplanar0 device in all AIX and VIOS LPARs on that system.)
- When a problem is resolved, return to the Task Selection menu and choose Log Repair Action.
- Use the cursor keys to navigate to each device name that you performed a corrective action on or that reported a problem and press Enter to mark it.
- Use the Commit option to log the repair action or actions. A message is displayed confirming that repair actions were logged.
- Use the Exit option to exit diagnostics. Or use the Cancel option to back up to the previous menu.
- AIX
- Log in as root.
- Enter diag at the command prompt and press Enter.
- At the Operating Instructions screen, press Enter to continue.
- At the Function Selection menu, choose Task Selection.
- At the Task Selection menu, scroll down choose Display Previous Diagnostic Results.
- Use either the Display Previous Results or Display Diagnostics Summary tasks to view previously reported events. Follow the recommended actions to resolve each problem reported. If hardware service or replacement is needed, or you do not understand the event or what actions are needed, contact support for assistance. (Note: The "sysplanar0" device name refers to the entire system, not a system planar. All events for power, cooling, processors, memory, system bus, system firmware, and environmental issues are reported under this device name. If the system is managed by an HMC, use the HMC to resolve these problems. Closing the related Serviceable Event for a system event on the HMC automatically logs a repair action for the sysplanar0 resource in all AIX and VIOS LPARs on that system.)
- When a problem is resolved, return to the Task Selection menu and choose Log Repair Action.
- Use the cursor keys to navigate to each device name that you performed a corrective action on or which reported the problem and press Enter to mark it.
- Use the Commit option to log the repair action or actions. A message is displayed confirming that repair actions were logged.
- Use the Exit option to exit diagnostics. Or use the Cancel option to back up to the previous menu.
- Linux
- Log in as root.
- Use the servicelog command (part of the Linux On Power Service and Productivity Tools) together with reviewing dmesg command output and /var/log/messages file content to determine the cause. For RTAS events, see Diagnosing RTAS events. If hardware service or replacement is needed, or you do not understand the event or what actions are needed, contact support for assistance.
- When the problem is resolved, use the log_repair_action command to mark the problem as resolved.
- IBM i
See Deactivating the indicator light by using the IBM i operating system in IBM Documentation. In step 10, you must perform the service procedures listed before you acknowledge the errors or close any entries. If hardware service or replacement is needed, or you do not understand the event or what actions are needed, contact support for assistance.
When all outstanding problems in an LPAR are resolved, the attention indicator for that LPAR turns off automatically. If the system has only one LPAR, the physical attention LED also turns off. If the system has multiple LPARs, when all outstanding problems in all LPARs are resolved, and all outstanding system events are resolved, the system's physical attention LED also turns off.
Resolving The Problem
If all problems are already resolved but the attention indicator or LED is still on, you can manually turn it off with one of these procedures. Beware that manually turning off the attention indicator or LED does not resolve the problem. If the problem is not resolved, the attention indicator or LED might turn back on later, or the system might continue operating with the problem. Leaving the problem unresolved can lead to consequences such as performance degradation, data loss, or an unplanned outage.
- HMC
- Carbon GUI (HMC V10R2 and newer)
Click the toggle slide switch (
 ) next to the attention symbol, select the managed system, and click . Or see Deactivating a system attention LED or partition LED by using the HMC in IBM Documentation for Power10 Systems.
- Enhanced+ GUI (HMC V8R8.4.0 - V10R1)
See Deactivating a system attention LED or partition LED by using the HMC in IBM Documentation for Power9 Systems.
- Classic GUI (HMC V7 - V8R8.6.0)
- In the navigation area, expand Systems Management and choose Servers.
- Select the system with the attention symbol (
 ) shown.
 - In the Tasks area, expand the Operations group.
- Expand the LED Status group.
- Click Deactivate Attention LED.
- In the confirmation dialog box, click OK.
- HMC Command Line Interface (CLI)
The system attention LED can be turned off with the chled command.
-
The managed system name is needed to run the chled command. If you do not already know the name of the system, use the lssyscfg command to retrieve all the managed systems names:lssyscfg -r sys -F name
-
Once you know the managed system name, check to see whether the attention LED is active on that system:lsled -r sa -t phys -m <managed_system>Look for an attribute like "state=on".
-
Use the chled command to turn off the system attention LED:chled -r sa -t phys -m <managed_system> -o off
-
To verify that the system attention LED turned off, use the lsled command again:lsled -r sa -t phys -m <managed_system>Look for an attribute like "state=off".
For more information on using the chled or lsled commands use the man page command on the HMC:man chled
man lsled -
- Carbon GUI (HMC V10R2 and newer)
- VIOS
See Deactivating the indicator light for a part by using the VIOS tools in IBM Documentation.
- AIX
See Deactivating the indicator light for a part by using AIX® diagnostics in IBM Documentation
- Linux
See Deactivating the indicator light by using the Linux operating system in IBM Documentation.
- IBM i
See Deactivating the indicator light by using the IBM i operating system in IBM Documentation.
- ASMI
If you are not able to turn off the system attention LED in the operating system or from an HMC, you might need to turn off the system attention LED manually in ASMI. Expand the section that applies to your system model:
- Systems with FSPs (Power10 9080-HEX and all Power9 and older systems)
- Access ASMI. If the system is not managed by an HMC, you might need to directly connect to one of the HMC ports on the back of the system. For more information, see Managing the Advanced System Management Interface. Or, if the HMC ports on the back of the system are connected to a network, use Operator Panel Function 30 to find the existing IPs on the HMC ports, then use a web browser on a computer connected to that network to access ASMI.
- Log in as user "admin". If you do not know the admin user password and the default does not work, contact support for assistance resetting it.
- In the menu, navigate to System Configuration -> Service Indicators -> System Information Indicator.
- If the status is "On", click the "Turn off the system information indicator" button.
- In the menu, navigate to System Configuration -> Service Indicators -> Enclosure Indicators.
- Select the enclosure that shows a status of "On" or "Identify" or "Fault", then click Continue.
- This page lists all amber identify and fault LEDs in the enclosure. The location without a "-" in it is the enclosure indicator itself. Record the location codes shown next to any indicator set to Identify or Fault state. Then set all Identify and Fault indicators to "Off" and click Save Settings.
- If more than one enclosure showed "On", "Identify", or "Fault" state in step 6, repeat steps 5-7 for those enclosures.
- Verify that the physical attention LED on the system has turned off.
- Systems with eBMCs (Power10 except 9080-HEX and newer)
- Access ASMI. If the system is not managed by an HMC, you might need to directly connect to one of the HMC ports on the back of the system. For more information, see Managing the system by using the ASMI GUI. Or, if the HMC ports on the back of the system are connected to a network, use Operator Panel Function 30 to find the existing IP(s) on the HMC port(s), then use a web browser on a computer connected to that network to access ASMI.
- Log in as user "admin". If you do not know the admin user password and the default does not work, contact support for assistance resetting it.
- Navigate to Hardware Status -> Inventory and LEDs.
- Under System indicators, see the state of the System identify LED and System attention LED toggles. If either is on, click the toggle to turn it off.
- Scroll through the list of resources below looking for any with their Identify LED set to On and toggle them to Off.
- Verify that the physical attention LED on the system has turned off.
- Systems with FSPs (Power10 9080-HEX and all Power9 and older systems)
If you are not able to resolve the problem or need help with doing so, contact support for assistance.
Document Location
Worldwide
[{"Type":"MASTER","Line of Business":{"code":"LOB57","label":"Power"},"Business Unit":{"code":"BU058","label":"IBM Infrastructure w\/TPS"},"Product":{"code":"HW1A1","label":"IBM Power Systems"},"ARM Category":[],"Platform":[{"code":"PF025","label":"Platform Independent"}],"Version":"All Versions"}]
Was this topic helpful?
Document Information
Modified date:
07 December 2023
UID
ibm16891149