About cookies on this site Our websites require some cookies to function properly (required). In addition, other cookies may be used with your consent to analyze site usage, improve the user experience and for advertising. For more information, please review your options. By visiting our website, you agree to our processing of information as described in IBM’sprivacy statement. To provide a smooth navigation, your cookie preferences will be shared across the IBM web domains listed here.
White Papers
Abstract
For effective functioning of WebSphere DataPower appliances, monitoring of its components is crucial. Based on the type of object and the event type, the requirement for monitoring and its corresponding action varies. Apart from real-time monitoring, there is a need for historical data and pre-configured alerts that can provide insight into its functional parameters and may centrally administered, it can be used for a comparative analysis of a cluster of appliances in the enterprise. This article highlights how you can set up and deploy IBM Tivoli Composite Application Manager for DataPower appliances by using its inbuilt framework features.
Content
Introduction
IBM Tivoli Composite Application Manager (ITCAM) Agent for WebSphere DataPower Appliance is a Tivoli-based monitoring solution in its suite of products. It provides a comprehensive view on several operational parameters of the appliance. Unlike other agents, where it is generally co-hosted on the same system as the monitored product, it renders more configuration and deployment of the agent in a distributed environment.
This article assumes that the reader is familiar with basic concepts on DataPower, Tivoli Monitoring, and Simple Network Management Protocol (SNMP). This article uses DataPower XI52 V5.0.0.6 and ITCAM V6.23.
Overview of an ITCAM setup
ITCAM for DataPower integrates with the existing Tivoli Framework, the more component of the agent, and the monitored appliance. Figure 1 shows the essential components, which are the core components of the framework that are reused for a DataPower configuration.

Tivoli Enterprise Monitoring Agent
An agent is the only entity that communicates with the appliance. The Tivoli Enterprise Monitoring Agent (TEMA) is designated in the product code as "bn". It acts as bridge between the Tivoli monitoring suite and the appliance. The agent pulls the data from the appliance that uses a request-response paradigm on a Simple Network Management Protocol (SNMP). This is reflected as real-time data on the Tivoli Enterprise Portal Server (TEPS). SNMP (generally used to manage network peripherals) is an application protocol that is encapsulated in the User Datagram Protocol (UDP).
UDP is a connectionless transport layer (Layer 4) protocol in the OSI model that provides a simple and unreliable message service for transaction-oriented services. The communication between the appliance and Tivoli Agent is essentially a communication over UDP/IP between the SNMP agent in the appliance and the SNMP Manager on the server hosting the Tivoli Agent. This SNMP Manager is part of the SNMP Management Tool of the host operating system and separate from the Tivoli Agent. The communication between the Tivoli Agent and the Tivoli Framework happens over the TCP/IP protocol.
Both the SNMP Manager and Agent use the Management Information Base (MIB) containing variables of the appliance’s managed objects and its metadata that is organized hierarchically. Standard Object Identifiers (OIDs) that consist of dotted numeric strings (such as 1.3.6.1.4.1.14685.3.1.11) are used to traverse the MIB hierarchy to uniquely identify a managed object and fetch its value for a particular metric (CPU, Memory, and so on). Every OID representing an MIB variable has a corresponding value for the current state of the object. The request-response (GET, GET-NEXT, GET-RESPONSE) and notification (TRAP) data that goes in SNMP communication consists of these OIDs. For example, for CPU usage metrics of the appliance a request OID, representing the data attributes for dpStatusCPUUsage MIB object, are sent by the Tivoli Agent to the appliance. The response is a similar name-value pair OID (MIB OID + MIB value) to be deciphered by the SNMP Manager and further relayed by the agent to the Tivoli Framework. This response is a single data point (scalar) like memory usage, or multiple data points (tabular) like CPU usage (10 sec/1 min/ 10 min/ 1 hour/ 1 day). Status, configuration, and notification MIBs are available for download from the appliance, if needed, to enable the SNMP Managers to translate between the MIB data objects and the OIDs.
Apart from polling, traps and notifications are configured on the appliance, enabling SNMP events to be pushed from the appliance to the agent. Additionally, situations are configured on TEPS to generate events at sampled intervals for any triggering conditions set on TEPS.
Considering a simple scenario of a 2-WebSphere DataPower topology (not illustrated in Figure 1), individual agents are deployed on separate hosts for its respective appliance. In case of a shutdown or unavailability of a host, one of the appliances will not be monitored as its corresponding agent also be down. To manage such scenarios, another agent is configured to be in standby mode on the other host. In case of a shutdown of one of the hosts, the agent on the other host is started. This is done either through an automated High Available (HA) scripts or a manual switchover process. In case of a manual switchover of the agent, there is window of a few minutes when the appliance is not monitored. In such situations, manual monitoring of the appliance needs to be done with the help of a Web GUI. In this arrangement, both appliances are monitored almost all the time. This reduces the dependency or point of failure of the agent host.
Tivoli Enterprise Portal Server
The Tivoli Enterprise Portal Server (TEPS) is a portal application, which is used by the administrators to view monitored data of the product and to manage its access through user workspaces. It fetches real-time polling data from the monitoring server. You can view this data either as an applet on the browser or use a thick client as a desktop client interface. It provides an interface to view historical data for a given set of metrics. It also provides an interface to configure situations to trigger alerts for a given set of conditions on a managed distribution list. Based on the severity of the alerts, it can be passed to the Netcool/Omnibus to take appropriate actions.
Tivoli Enterprise Management Server
The Tivoli Enterprise Management Server (TEMS) is the central control point for managing all the agents configured in the environment and plays a pivotal role by interfacing with all the other components in the framework. It is the collection and control point for performance and availability data along with alerts received from monitoring agents. In a large-sale environment, some of its functional load is distributed on a number of Remote Tivoli Enterprise Management Server (RTEMS) that interfaces with its set of monitoring agents.
Tivoli Data Warehouse
The Tivoli Data Warehouse (TDW) stores historical data from the agent for reporting and for future access perspective. Data is gathered from various agents at regular intervals and stored in the TDW. Typically, any data older than 24 hours is shipped from local files to the data warehouse by the Warehouse Proxy Agent (WPA). TDW is an existing component and reused to collect and accumulate the data from appliances for a longer duration. This data is helpful to monitor the health of the appliance over a period of time.
Remote Tivoli Enterprise Management Server (RTEMS)
The Remote Tivoli Enterprise Management Server (RTEMS) is functionally similar to TEMS, but it acts on a subset of monitoring agents allowing TEMS to distribute its load. It is often deployed in a large scale environment where multiple agents are deployed.
Warehouse Proxy Agent
The Warehouse Proxy Agent (WPA) sits alongside RTEMS, polling the data from remote agents and passes it on to TDW as historical data. This binary data is retrieved from agents or RTEMS (as configured) that uses remote procedure calls (RPC) at an interval varying from 1 hour to 24 hours. IP.PIPE, being reliable and faster, is used as the communication protocol for this data throughput. The uploaded data is then put on data structures called "work queues". The export threads then fetch the data sequentially from the queues and insert it into TDW that uses the JDBC/ODBC bridge.
Netcool/Omnibus
The Netcool/Omnibus acts as a common bus that collects and consolidates different types of alarm information and notifications (based on event information) in real-time to trigger automatic responses (such as SMS, eMail, and so on), or to create incidents as part of the service level management system.
Setup of the DataPower Agent Framework
The following sections explain the steps involved in setting up the DataPower Agent Framework. You need to open firewalls between the UDP ports configured on the Appliance-Agent and the TCP ports between the Agent-RTEMS. SNMP is a standard protocol that is used for communication between the agent and the appliance. Therefore, the SNMP Management Framework is assumed to be existing on the machine hosting the Tivoli Agent with SNMP trap service running on the port configured (default 162). The following setup has been done for DataPower XI52 with firmware V4.0.2.5 and DataPower Monitoring Agent V06.30.00.00 on AIX v6.1. Steps may vary or be similar for other versions and operating systems. Refer to the manuals in the Related topics section and product guidelines in the Information Centers for the required prerequisites and compatibility matrix.
Installation of the agent
- Get the corresponding media (CZM1HEN.tar) applicable to your particular OS.
- Install products to the local host.
- Accept the license and the default Encryption Key.
- Select the OS version.
- Select the agent version.
- Apply the fix packs(optional).
Note that this installation utilizes "GSkit" of the existing agent (such as an OS agent), if any, on the system.
Verify the installation that uses the "cinfo(./cinfo –t)" command (Figure 2).

Additionally, the component support needs to be installed on TEPS and TEMS in the existing Tivoli Framework (see the above topic). This enables the core Tivoli components to integrate with the agent. This is bundled in the same media.
For post-installation, proceed with the configuration of the agent from the console that uses "itmcmd" (./itmcmd config –A bn) or the GUI-based interface. The SNMP configurations need to be the same on the agent and the DataPower SNMP settings.
Configuration of the agent
- Agent instance configuration:
- Instance Name: Give a unique instance name for the agent.
- SNMP configuration for polling and real-time data:
- Polling the SNMP UDP port number of DataPower Appliance (default 161).
- SNMP version to be used to make connection: v1 (based on unencrypted community name), v2c (based on party and context model having encrypted community name), v3 (based on user based security model). v2c is used in our case.
- SNMP community name (only if v1 or v2c is selected above): Give a specific name to this community. Avoid generic names such as "public".
- SNMP configuration for traps and notifications generated by the appliance:
- Receiving SNMP UDP port number Agent LPAR (default 162). This port must be different across all instances of this agent.
- SNMP version to be used to make connection: v1 (based on unencrypted community name), v2c (based on party and context model having encrypted community name), v3 (based on user based security model). v2c is used in our case. Subsequent configuration, though applicable for notifications on SNMPv3, is not a problem if v1 or v2 is used on the appliance (as in our case).
- Authentication and privacy (encryption) protocols: Security Level - [ 1=Authentication, Privacy, 2=No Authentication, No Privacy, 3=Authentication, No Privacy ] - Authentication, Privacy is chosen in our case.
- SNMP User name
- SNMP Authentication Protocol - [1=SHA, 2=MD5]: SHA is chosen.
- Authorization Pass Phrase
- SNMP Privacy Protocol (default is DES)
- Privacy Pass Phrase
- DataPower system details:
- IP address of DataPower
- RTEMS configuration:
- Hostname/IP Address of the primary RTEMS
- Network protocol [ip, sna, ip.pipe or ip.spipe] – ip.pipe is chosen.
- Network Protocol 2: none.
- Port Number (default is 1918).
- KDC_PARTITION name: null.
A similar configuration needs to be done for the secondary TEMS, if any.
The SNMP configuration is stored in the "Hostname_bn_Instance-Name.cfg" file in the config directory (see Figure 3).
Any change in the default configuration for the agent needs to be done in the "bn.config" file in the config directory.

For post-configuration, start the agent from the console (./itmcmd agent -o agent_instance start bn). Use the "cinfo" command (./cinfo –r) to verify if the agent has started. The output looks similar to Figure 4.

Configuration of the DataPower SNMP settings
Using the Web GUI of the DataPower appliance, navigate to the SNMP settings that uses the admin profile to configure the following:
- Main tab
- Admin State: enabled
- Local UDP port on the appliance (default is 161): To receive SNMP requests from Agent
- Local IP Address: Select the host-alias/IP Address mapped to any of the Ethernet interface, if designated for SNMP traffic.
- SNMPv3 Configuration: This is not applicable in our case. Accordingly, if you are using v3, specify a user, security level, and access level, .
Note: If you are using SNMP v3, you must have SNMPv3 user credentials configured (user account) with an authentication protocol/secret type/secret and privacy protocol/secret type/secret configured identically as in the agent.
- Enterprise MIBs tab: This is not applicable in our case as the OIDs (object identifiers) generated by the appliance are deciphered by the agent on AIX. It is applicable when the SNMP Manager needs a Management Information Base (MIB) for configuration, status, or notification.
- Trap Event Subscriptions tab:
- Enable Default Event Subscriptions: on
- Minimum Priority: error (set as required)
- Event Subscriptions: Select any of the codes from the list to subscribe to any event (such as 0x00030002, out of memory).
- SNMPv1/v2c Communities tab:
- Add a community.
- Give a specific community name. It must be identical to the agent configuration.
- Associated domain (default): Other application domains could be set if the application monitoring metrics (such as HTTP Transaction Status) are desired.
- Mode as read-only: This allows only get operations in SNMP requests.
- Remote Host Address as default 0.0.0.0/0: This can be restricted to a specific host if the appliance is required to respond to requests from a specific SNMP manager in the community.
- Alternately, configure in the SNMPv3 configuration in the Main tab if the agent is configured to use v3 for polling.
- Trap and Notification Targets tab:
- Add the target.
- Remote Host Address: IP Address of the Agent Host Machine.
- Remote Port (default is 162): This is the same as configured during the agent configuration.
- Community Name: Name used in the agent. It is applicable for v1/v2c.
- Version: 2c (in our case)
- Security Name: Applicable for v3. The SNMP User Name is configured in the agent and in the user account in the appliance.
- Security Level: It is applicable for v3 and configured in the authentication and privacy (encryption) protocols in the agent configuration.
- SNMPv3 Contexts tab: This is not applicable in our case.
Verification of the configuration
The DataPower node appears on the Navigator panel in the TEPS portal (see Figure 5). Search for the node with its physical IP address and hostname.

Depending on the logging level, logs are generated in the logs directory of the agent (for polling, notification, connectivity, and situations) with the following file-patterns:
Hostname_bn_Instance-Name_kbnagent_xxxx.logInstance-Name: Hostname:BN.LG0.
In case of any issues, troubleshooting needs to be done based on these logs.
Polling (get-next-request and get-response) and Notification (SNMPv2-Trap) Data can be verified that that use of Packet-Capture from troubleshooting the DataPower Control panel (Figure 6).

Monitored data
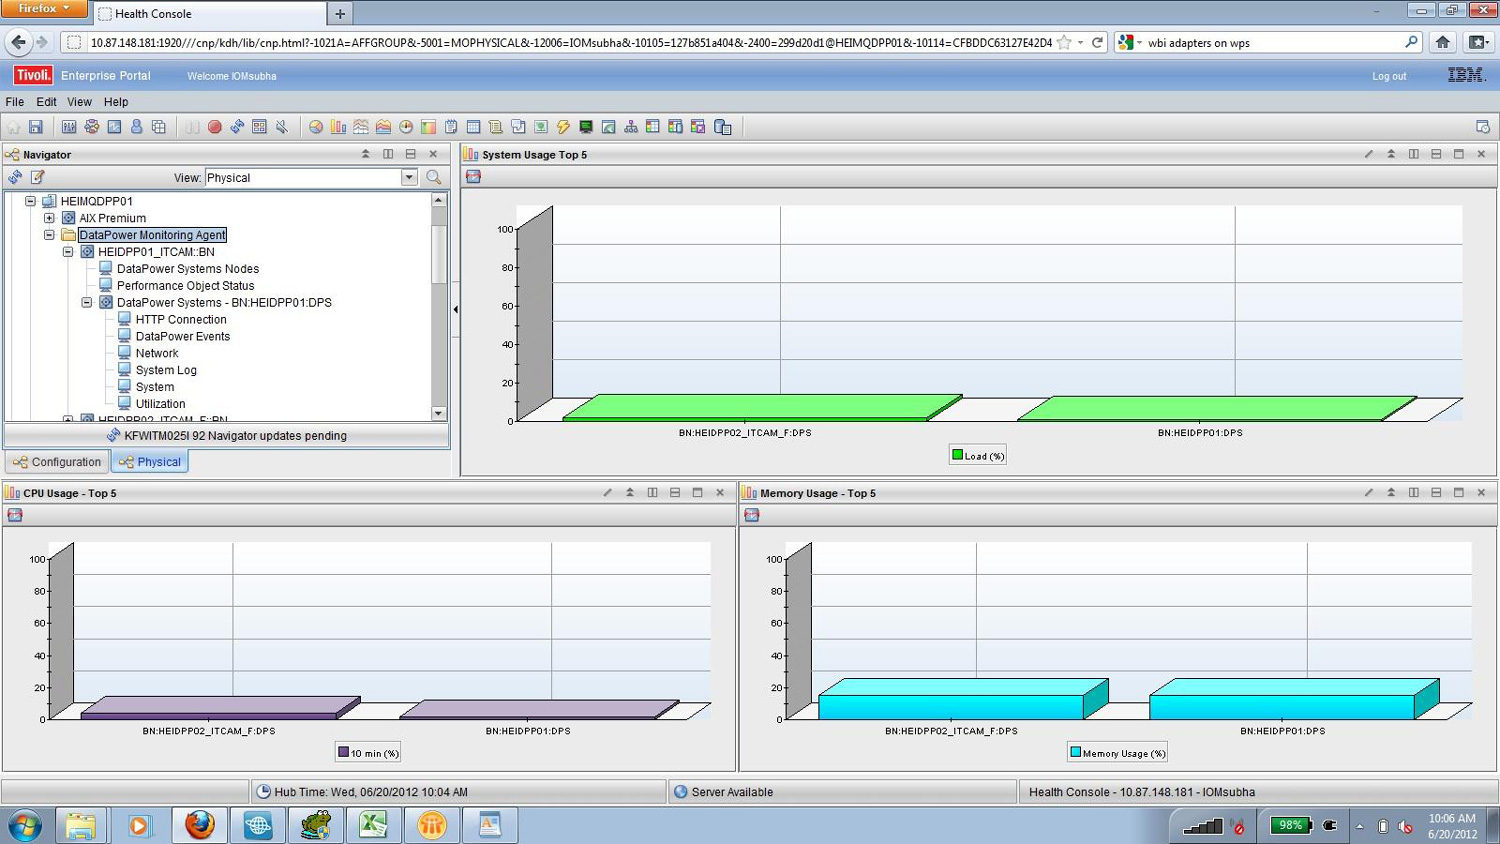
In this section, various snapshots are displayed to illustrate the real-time metrics captured by the ITCAM agent at regular intervals. At the top-most level in navigator panel, the "DataPower Monitoring Agent" displays comparative information of multiple DataPower appliances configured in the enterprise. This view comprises of a system, CPU, and memory usage of the respective appliances (Figure 7).

Following this are individual groups for each agent instance. The summary information of the DataPower Appliance is displayed in the expanded section containing "DataPower Systems – BN:Hostname:DPS". This information comprises of the System Uptime, System Load, CPU Usage, and Memory Usage (Figure 8).


If any application domain is configured in the SNMP settings of the appliance (refer to the previous section on Configuration of the DataPower SNMP settings), or any services configured in default domain, you can obtain performance information from the "HTTP Connection" attribute as displayed. The corresponding workspace comprises of the top 10 HTTP connection requests and statistics of the HTTP connections of XML Managers in the domain (Figure 9).


In a similar way, the workload information is obtained from the "Network" attribute, which displays the TCP Port Summary and its status.
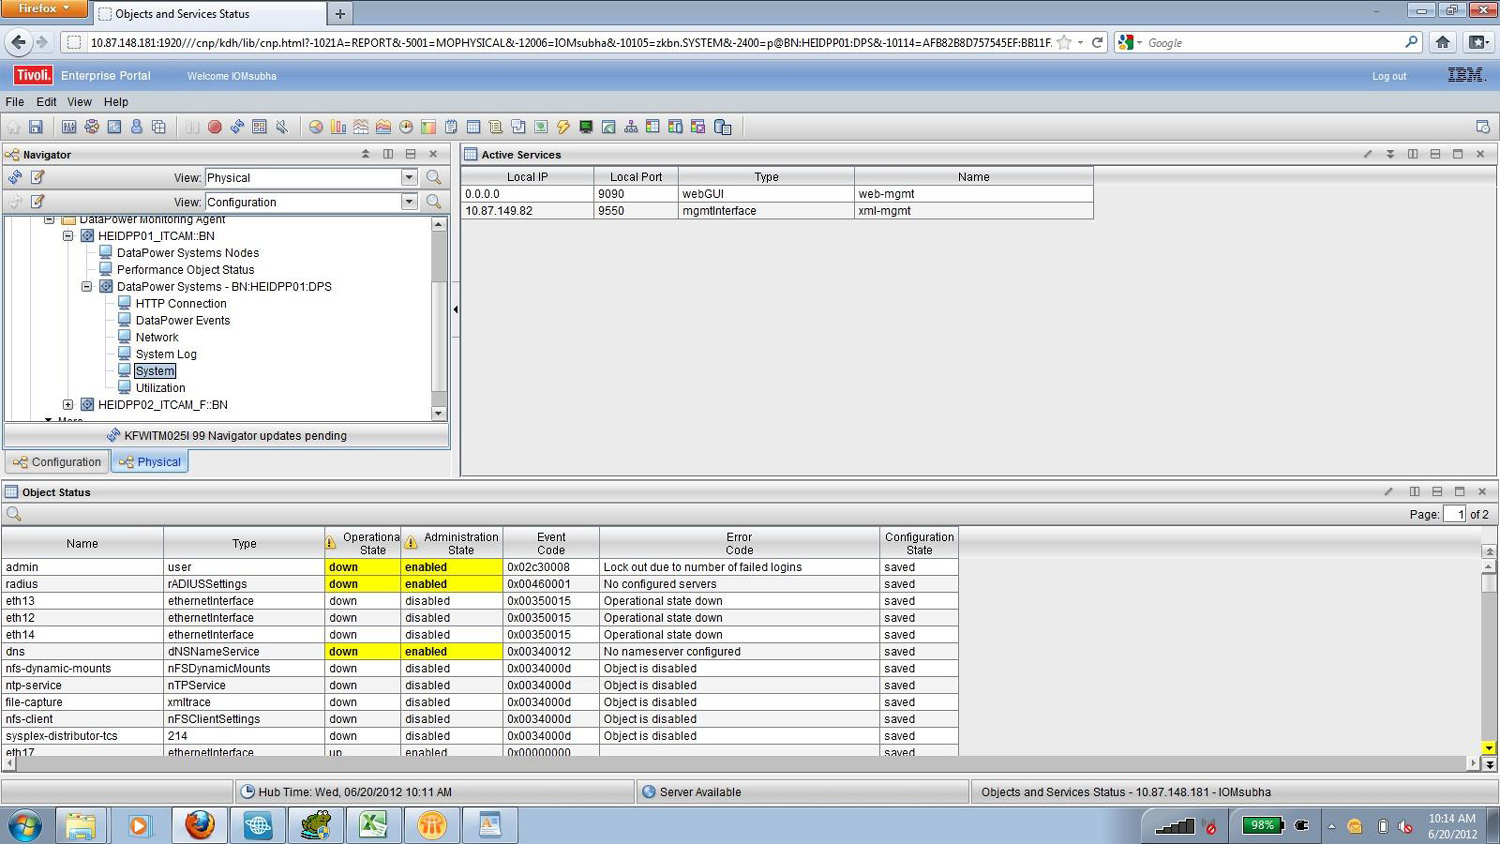
The "System" attribute displays availability information in the form of active services and object status by highlighting the ones that are down (Figure 10). This view is helpful in getting the error codes for operational states that are down and to help take appropriate action.

The resource information of the appliance is obtained from the "Utilization" attribute by displaying the file system, system, CPU, and memory usages (Figure 11). This view is helpful in correlating utilization across different metrics based on the appliance throughput.


Finally, the event information of the appliance is obtained from the "DataPower Events" attribute by displaying any situation in the DataPower Situation Event Console and a list of traps in the lower panel of "DataPower Events", which are notified by the appliance based on event subscriptions (Figure 12).


Configuring situations
You can configure DataPower on the TEPS Situation Editor in a similar fashion as with the other products. A set of pre-defined situations enlist frequently encountered and useful conditions. Needed formulas can be devised using attributes specific to the DataPower Agent and applied to a distribution of managed systems where the agents are deployed. Here is a sample formula:
#'KBNCPUUSAG.ONEMINUTE' > 40 for Average CPU Usage over last min > 40%
Scope of monitoring
The following areas are within the scope for ITCAM monitoring:
- CPU Usage
- DataPower Systems Nodes
- DPS Performance Object Status
- Ethernet Interface
- Filesystem Status
- Firmware Status
- Firmware Version
- HTTP Connections
- HTTPMeanTransactionTime2
- HTTP Transactions2
- Log Notification
- Log Target Status
- Memory Status
- Network ReceiveData Throughput
- Network TransmitData Throughput
- Object Status
- Performance Object Status
- Services Status
- System Log
- System Uptime
- System Usage
- System Usage Table
- Take Action Status
- TCP Summary
- TCP Table
- Thread Pool Status
Conclusion
This article described how to configure DataPower monitoring by using the IBM Tivoli suite to display useful metrics in real-time and historical domains. This is helpful in scenarios where a monitoring framework, such as ITCAM, exists already and a solution is needed for DataPower appliances. After you complete this article, you have a better understanding of the complexity and standard setup of ITCAM-based monitoring. To understand and evaluate the SOMA-based monitoring alternative, proceed to Part 3 in the series.
Acknowledgments
The authors would like to thank Rakesh R. Nair for his review of the article series. Rakesh is a WebSphere DataPower specialist and has led many DataPower-based engagements for worldwide customers.
[{"Business Unit":{"code":"BU053","label":"Cloud & Data Platform"},"Product":{"code":"SS9H2Y","label":"IBM DataPower Gateway"},"Component":"","Platform":[{"code":"PF025","label":"Platform Independent"}],"Version":"","Edition":"","Line of Business":{"code":"LOB45","label":"Automation"}}]
Was this topic helpful?
Document Information
More support for:
IBM DataPower Gateway
Document number:
1109631
Modified date:
08 June 2021
UID
ibm11109631
Manage My Notification Subscriptions
