Troubleshooting
Problem
A "Performance degradation has been detected in the event pipeline. Event(s) were routed directly" alert appears in the notifications.
Diagnosing The Problem
- Click the notifications to view the alerts:

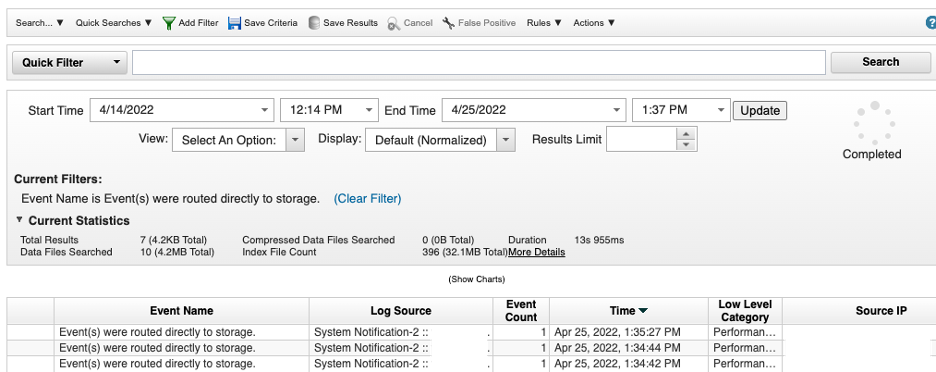
- Click View All next to the notification to open a new search view. Example of a search:
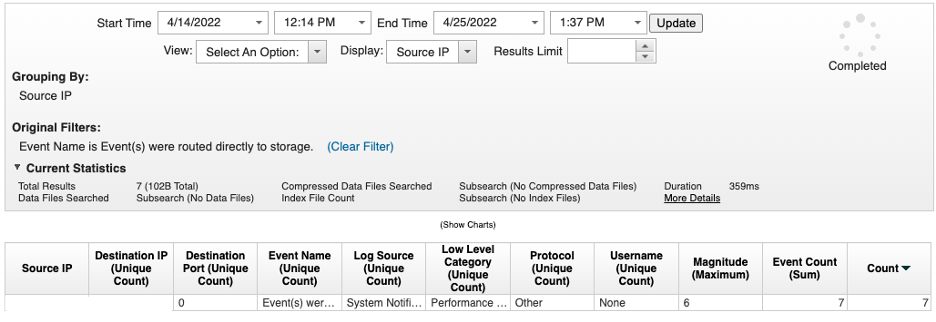
- (Optional) If there are multiple appliances experiencing performance degradation, change the Display drop down from Default (Normalized) to Source IP to identify the appliances experiencing the error. Each unique Source IP found here represents a different host affected by the performance degradation:
- To narrow the search for routing to storage at device parsing (DSM Filter), use this AQL search:
Select sourceip as 'IP', COUNT(*) from events where qid='38750088' and utf8(payload) ILIKE '%DSMFilter%'GROUP BY IP last 24 HOURS;To narrow the search for routing to storage in the Custom Rule Engine (EPCRE), use this AQL search:Select sourceip as 'IP', COUNT(*) from events where qid='38750088' and utf8(payload) ILIKE '%Custom Rule Engine%'GROUP BY IP last 24 HOURS;
- To narrow the search for routing to storage at device parsing (DSM Filter), use this AQL search:
- Determine which service in the pipeline is causing the issue by viewing the payloads of the events.
Note: It is possible to see performance degradation at both ecs-ec and ecs-ep on the same system at the same time.
Result
If the payload refers to Device Parsing, then the issue is occurring at the ecs-ec portion of the pipeline:[ecs-ec.ecs-ec] [[type=com.eventgnosis.system.ThreadedEventProcessor][parent=hostname:ecs-ec/EC/Parsing/DSM_Normalize]] com.ibm.si.ec.filters.normalize.DSMFilter: [WARN] [NOT:0080004101][IP/- -] [-/- -]Device Parsing has sent a total of 465454 event(s) directly to storage. 32655 event(s) have been sent in the last 60 seconds. Queue is at 0 percent capacity.If the payload refers to Custom Rule Engine, then the issue is occurring at the ecs-ep portion of the pipeline:[ecs-ep.ecs-ep] [[type=com.eventgnosis.system.ThreadedEventProcessor][parent=hostname:ecs-ep/EP/Processor2]] com.q1labs.semsources.cre.CRE: [WARN] [NOT:0080004101][IP/- -] [-/- -]Custom Rule Engine has sent a total of 37231337 event(s) directly to storage. 58327 event(s) were sent in the last 60 seconds. Queue is at 100 percent capacity.
Resolving The Problem
Depending on how the environment is configured, it can require an investigation into each appliance that is experiencing performance degradation.
If the issue is caused by ecs-ec, then refer to the Identifying DSM and optimized custom property issues documentation.
If the issue is caused by ecs-ep, then refer to the QRadar: Troubleshooting Custom Rule performance with findExpensiveCustomRules.sh and Rule performance visualization documentation.If the problem still persists, contact support and include the following information in your case:
- System logs collected from each affected appliance. Use the Source IP from the notification (as described in the Diagnosing the Problem section) to identify the appliance or appliances.
- SSH into the QRadar Console and run the support scripts for the service that is causing the issue:
- For ecs-ec, run
/opt/qradar/support/findExpensiveCustomProperties.sh - For ecs-ep, run
/opt/qradar/support/findExpensiveCustomRules.sh
- For ecs-ec, run
Document Location
Worldwide
[{"Type":"MASTER","Line of Business":{"code":"LOB24","label":"Security Software"},"Business Unit":{"code":"BU059","label":"IBM Software w\/o TPS"},"Product":{"code":"SSBQAC","label":"IBM Security QRadar SIEM"},"ARM Category":[{"code":"a8m0z000000cwtiAAA","label":"Performance"}],"ARM Case Number":"","Platform":[{"code":"PF025","label":"Platform Independent"}],"Version":"All Versions"}]
Was this topic helpful?
Document Information
Modified date:
12 December 2022
UID
ibm16590887