How To
Summary
Users who experience slow searches can use the Current Statistics field on the Log Activity or Network Activity tab. The statistics for an Ariel search can help you understand the volume of data QRadar appliances are searching and view the search progress on individual appliances.
Objective
Users can review Current Statistics to understand the volume of data being searched by QRadar. When a user runs a search, the Console asks all appliances in the deployment whether it has data that matches the search. The appliances receive query and start the search for matches. As appliances locate results, the results stream back to the Console to display the results. The current statistics provide the user information about the size and volume of data returned from all appliances as a summary. 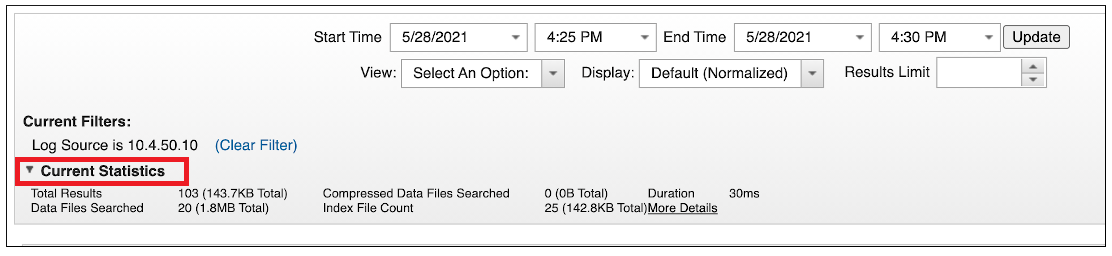
Figure 1: Current Statistics summarizes the size of the search as appliance return data as results.
Table 1: Definitions for statistics provided in search results.
| Statistic | Explanation | Example |
| Total Results | This metric displays a summary of how many events or flow records matched the search from all appliances. | Total Results 103 (143.7KB Total) |
| Data Files Searched |
Total count and size of all data files on all hosts that had to be accessed during the search. A search with a long timeframe can have just a few results, but might need to check thousands or millions of payload or record files, which can be slow.
|
Data Files Searched 20 (1.8MB Total) |
| Compressed Data Files Searched | Compress data is a legacy metric and no longer used. It is common for this metric to always display 0, unless you are on an older version of QRadar or migrated compressed data from an old QRadar version. | Compressed Data Files Searched 0 |
| Index File Count | QRadar indexes Ariel data by property in different files, so when you use any indexed field in the filters. The metric displays the total count and size of all data files on all hosts that had to be accessed during the search. | Index File Count 25 (142.8KB) |
| Duration | The amount of time to complete the search. | Duration 30ms |
Steps
To view details for each appliance:
- Click the Log Activity or Network Activity tab.
- Run any search.
- To view appliance-level search details, click More Details.
Results
The More Details screen displays a breakdown of the current statistics summary with the results from all the managed hosts. This detailed view can provide users with an indicator of which hosts have results or uses more resources with searches. Only appliances that run Ariel Query Server display results in this view. For more information, see QRadar: About searches and data storage.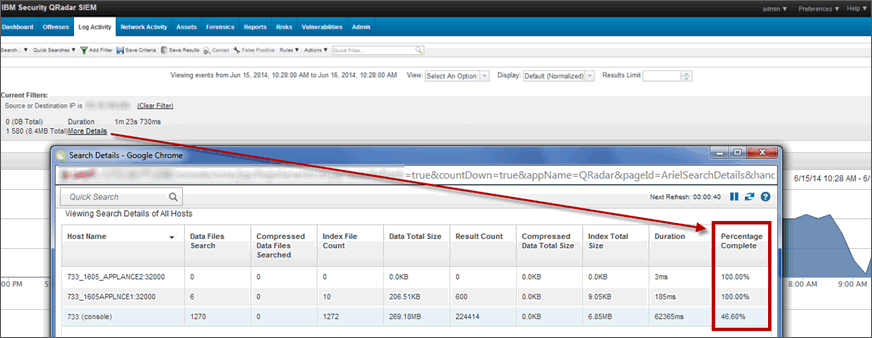
Document Location
Worldwide
[{"Type":"MASTER","Line of Business":{"code":"LOB24","label":"Security Software"},"Business Unit":{"code":"BU059","label":"IBM Software w\/o TPS"},"Product":{"code":"SSBQAC","label":"IBM Security QRadar SIEM"},"ARM Category":[{"code":"a8m0z000000cwt8AAA","label":"Ariel"}],"ARM Case Number":"","Platform":[{"code":"PF025","label":"Platform Independent"}],"Version":"All Version(s)"}]
Was this topic helpful?
Document Information
Modified date:
31 August 2021
UID
ibm16457325