Troubleshooting
Problem
If not tuned properly, custom rules can cause performance issues. Warning messages such as "Custom Rule Engine has sent a total of X event(s) directly to storage" in qradar.error can indicate issues with rules. This article explains how to troubleshoot rule performance by using the findExpensiveCustomRules.sh script.
Cause
A common cause for this issue is rules that need to be tuned in the QRadar deployment. If a rule takes too long to execute, it could cause a performance issue. The result can cause events to be routed directly to storage.
Examples of Expensive Rules are:
- Payload-related tests that use Pattern or Curly regex-based calls.
The order in the rule can make the difference between a good rule and an expensive rule. - Host and Port Profiles are expensive, particularly when the asset and port vulnerability databases are large.
Diagnosing The Problem
If events were sent to store, messages similar to the following appear in qradar.error:
[[type=com.eventgnosis.system.ThreadedEventProcessor][parent=device_name:ecs-ep/EP/Processor2]] com.q1labs.semsources.cre.CRE: [WARN] [NOT:0080004101][x.x.x.x/- -] [-/- -]Custom Rule Engine has sent a total of 5455 event(s) directly to storage. 5455 event(s) were sent in the last 60 seconds.  Queue is at 80 percent capacity.
[[type=com.eventgnosis.system.ThreadedEventProcessor][parent=device_name:ecs-ep/EP/Processor2]] com.q1labs.semsources.cre.CRE: [WARN] [NOT:0080004101][x.x.x.x/- -] [-/- -]Custom Rule Engine has sent a total of 2734 event(s) directly to storage. 2734 event(s) were sent in the last 60 seconds.  Queue is at 100 percent capacity.
Resolving The Problem
What is the findExpensiveCustomRules script?
The findExpensiveCustomRules.sh script is designed to query the QRadar data pipeline and report on the processing statistics from the Custom Rules Engine (CRE). The script monitors metrics and collects statistics on how many events hit each rule, how long it takes to process a rule, total execution time, and average execution time. When the script completes, it turns off these performance metrics. The findExpensiveCustomRules.sh script is a useful tool for creating on-demand reports for rule performance and not for tracking historical rule data in QRadar. The core functionality of this script is often run when users see events routed to storage between components in QRadar.
The findExpensiveCustomRules.sh script is designed to query the QRadar data pipeline and report on the processing statistics from the Custom Rules Engine (CRE). The script monitors metrics and collects statistics on how many events hit each rule, how long it takes to process a rule, total execution time, and average execution time. When the script completes, it turns off these performance metrics. The findExpensiveCustomRules.sh script is a useful tool for creating on-demand reports for rule performance and not for tracking historical rule data in QRadar. The core functionality of this script is often run when users see events routed to storage between components in QRadar.
Part 1: How to run the findExpensiveCustomRules script
Depending on whether you have QRadar SIEM or QRadar Saas, use one of these two methods:
Generating the report on QRadar SIEM
- Using SSH, log in to the QRadar appliance that is reporting the events routed to store.
The following appliance types run ECS-EP and the log files show the hostname of the appliance that is reporting the issue:- QRadar 16xx Event Processor appliances
- QRadar 17xx Flow Processor appliances
- QRadar 18xx Combination Event and Flow appliances
- QRadar 21xx Log Manager appliance
- QRadar 31xx Consoles
- Run the findExpensiveCustomRules.sh script to review for any rules that are expensive and tune them as required:
/opt/qradar/support/findExpensiveCustomRules.sh -d /rootNote: The -d option specifies the path of the output of findExpensiveCustomRules.sh
Example output:Data can be found in /root/CustomRule-2022-03-02-905476050.tar.gz - Use WinSCP or an equivalent tool to move the CustomRule-yyyy-mm-dd-seconds.tar.gz file to your local laptop or workstation.
- Use a compression utility to extract the CustomRule-yyyy-mm-dd-seconds.tar.gz file to a .tar file.
- Extract the .tar file a second time to access the Expensive Custom Rules report text file. The output contains a .txt file, .xml file, and a folder named "reports".
- Open CustomRule-yyyy-mm-dd-seconds.txt file in any spreadsheet program as a CSV file.
Alternatively the output can be analyzed by using the command line by:
- Decompressing the file generated
-
tar -xvzf <file_name>
Example:
tar -xvzf CustomRule-2022-10-24-17-37.tar.gz
-
- Moving to the new decompressed folder:
-
cd CustomRule-2022-10-24-17-37
-
- Open the reports/AverageTestTime-<date_stamp>.report and reports/AverageResponseTime.report files.
-
head reports/AverageTestTime-* reports/AverageResponseTime-* | sed 's/com.*\,name\=//g'
-
Generating the report on QRadar SaaS
- To generate the performance report, follow the steps from this document. Select the desired managed host and the findExpensiveCustomRules script.
- With the downloaded file, use a compression utility to extract the CustomRule-yyyy-mm-dd-seconds.tar.gz file to a .tar file.
- Extract the .tar file a second time to access the Expensive Custom Rules report text file. The output contains a .txt file, .xml file, and a folder named "reports".
- Open CustomRule-yyyy-mm-dd-seconds.txt file in any spreadsheet program as a CSV file.
Alternatively the output can be analyzed by using the command line on a Linux host by:
- Decompressing the file generate:
-
tar -xvzf <file_name>
Example:
tar -xvzf CustomRule-2022-10-24-17-37.tar.gz
-
- Moving to the new decompressed folder:
-
cd CustomRule-2022-10-24-17-37
-
-
Open the reports/AverageTestTime-<date_stamp>.report and reports/AverageResponseTime.report files.
-
head reports/AverageTestTime-* reports/AverageResponseTime-* | sed 's/com.*\,name\=//g'
-
Part 2: What to look for in the CustomRule report
- Sort the AverageResponseTime column and AverageTestTime column to look for large values. It identifies which rules take more time on average to run than others. Expensive rules are displayed first and are typically a magnitude larger in size than the rules that are running efficiently. Look for values that are 0.01 or larger, which are considered potentially expensive and require review.
- Alternately, review the TotalExecutionTime column to find the rules that are taking much longer to complete than other rules.
- Typically, rules that use "Payload Contains" or "Payload Matches REGEX" are expensive.
- Review the output of this report to match rule names from the Dashboard System Notifications to execution time for that specific rule in QRadar.
- If AverageTestTime is high, but the event count is low, the rule might not be what is causing the issue.
Example report: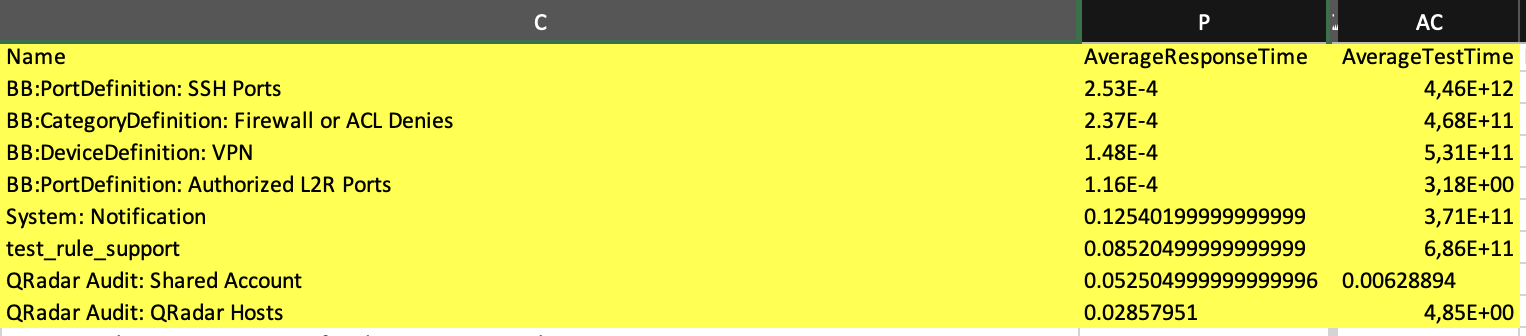
Output example if the file is being reviewed by using the command line:
==> reports/AverageTestTime-2023-06-09-17-24.report <==
0.00628894 Rule_QRadar Audit> Shared Account
0.005786699999999997 Rule_Reference Test
0.002238430000000001 Rule_User>BB>HostDefinition> Server Type 3 - User Defined
0.0018611400000000022 Rule_Excessive Firewall Denies from Single Source
0.0018289500000000021 Rule_BB>HostDefinition> Virus Definition and Other Update Servers
0.0018138199999999996 Rule_Local host on Botnet CandC List (DST)
0.0018058699999999996 Rule_Host Port Scan Detected by Remote Host
0.0017851399999999984 Rule_BB>NetworkDefinition> Honeypot like Addresses
0.0017358700000000016 Rule_BB>NetworkDefinition> Broadcast Address Space
0.001588610000000001 Rule_BB>NetworkDefinition> Darknet Addresses

==> reports/AverageResponseTime-2023-06-09-17-24.report <==
0.12540199999999999 Rule_System> Notification
0.08520499999999999 Rule_test_rule_support
0.052504999999999996 Rule_QRadar Audit> Shared Account
0.02857951 Rule_QRadar Audit> QRadar Hosts
3.7099999999999996E-4 Rule_BB>DeviceDefinition> FW fsl Router fsl Switch
2.53E-4 Rule_BB>PortDefinition> SSH Ports
2.37E-4 Rule_BB>CategoryDefinition> Firewall or ACL Denies
1.9846000000000008E-4 Rule_Source Address is a Bogon IP
1.945789473684211E-4 Rule_BB>CategoryDefinition> Superuser Accounts
1.882699999999999E-4 Rule_Source Asset Weight is Low
Part 3: What to do next
- Find the expensive Rule in the Offenses tab and disable it. Do not modify or delete the rule yet.
- Verify in the Dashboard notifications to confirm if the warnings no longer appear.
- If the notifications are still occurring, recheck the CustomRule report and verify whether there are any other entries that look suspicious.
- If you confirm that the disabled rule is causing the notifications, modify it to be less expensive or delete it.
Note: The sequence that the rules are laid out can make a difference in performance. Information on best practices for writing rules can be found in Everything you need to know about QRadar Rules (for beginners and experts)
Part 4: Alternate issues that can cause Custom Rule error messages
- Verify whether any rules are configured as Global rules. In some cases, Global rules can cause excessive events to be processed by the console and resulting in an MPC queue to max out. In this case, change any Global rules to Local rules, if possible.
- Verify how many Managed Hosts (MHs) are in the deployment. Sometimes, when there are several MHs in the deployment, and only the console has 1k EPS, it might be required to get a 5k EPS console license from the licensing team. In this case, request a 5k EPS console license from q1pd@us.ibm.com.
- Payload-related tests that use "Pattern" or "Curly" regex-based calls can be expensive. Payload tests can end up scanning every event, if not careful. Try to filter on log source, log source type, and maybe an IP address before any payload tests. The order of tests makes a difference in the rule or CRE.
- Host and Port profiles are also expensive, especially if the asset database, port profile, or vulnerability data is large. For more information on host and port profiles, see the tuning guide.
- If the X-force data feed is enabled, X-force lookups can cause the error message.
Related Information
[{"Type":"MASTER","Line of Business":{"code":"LOB24","label":"Security Software"},"Business Unit":{"code":"BU048","label":"IBM Software"},"Product":{"code":"SSBQAC","label":"IBM Security QRadar SIEM"},"ARM Category":[{"code":"a8m0z000000cwtrAAA","label":"Rules"}],"ARM Case Number":"","Platform":[{"code":"PF016","label":"Linux"}],"Version":"All Versions"}]
Was this topic helpful?
Document Information
Modified date:
04 June 2024
UID
ibm11086063