Troubleshooting
Problem
Administrators who receive multiple system notifications related to 'Accumulator falling behind. See Aggregated Data Management for details' can review this technical note to disable or review existing global views in QRadar Aggregated Data Management module.
Diagnosing The Problem
QRadar display the following error message:
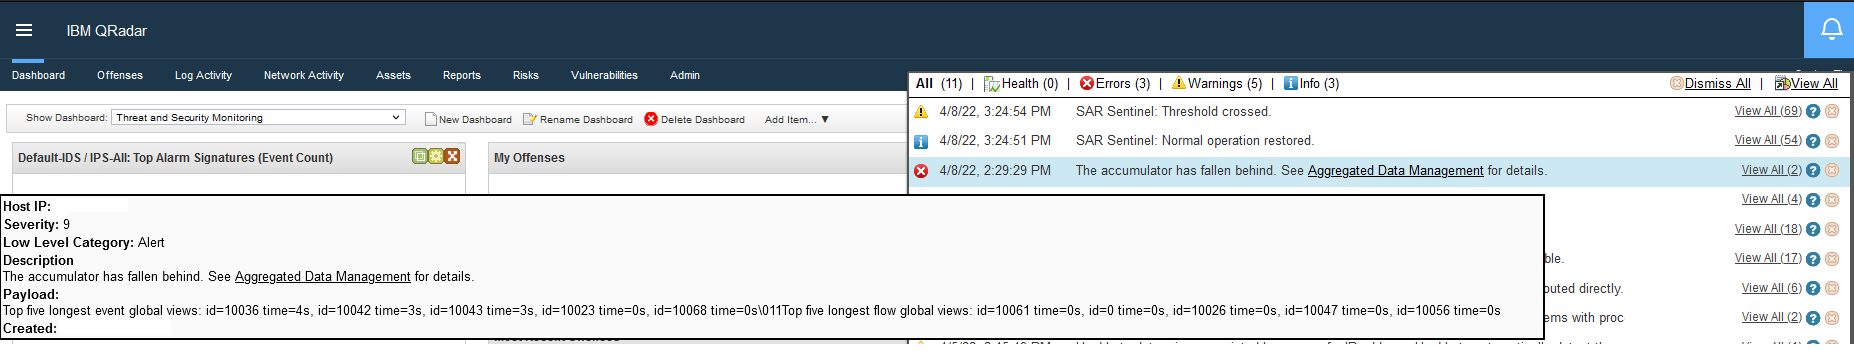
Figure 1: The system notification (38750099) payload displays problematic global views in the payload. It is expected that all accumulations complete in under 60 seconds.
This information can be reviewed historically from the Log Activity tab by searching for QID 38750099 and viewing the raw payload information. This error message appears when the system is unable to accumulate data aggregations within a 60-second interval.
This information can be reviewed historically from the Log Activity tab by searching for QID 38750099 and viewing the raw payload information. This error message appears when the system is unable to accumulate data aggregations within a 60-second interval.
Sometimes QRadar can present false positive messages for the accumulator like the following one:
"The accumulator has fallen behind. See Aggregated Data Management for details.": Top five longest event global views: id=10078 time=4s, id=10099 time=2s, id=10098 time=1s, id=10024 time=1s, id=10025 time=1s Top five longest flow global views: id=10047 time=0s, id=10072 time=0s, id=10075 time=0s, id=10028 time=0s, id=10031 time=0sTo identify if the issue real, check for the following:
- Any of the global views took more than 60 seconds to complete.
- The sum of the global views exceeds 60 seconds.
Result
Record the ID number for any individual global views that exceed 60 seconds. If no global view exceeds 60 seconds or the sum does not exceed 60 seconds, then administrators can treat this notification as a false positive and the error message can be ignored.
Resolving The Problem
Some reasons that this type of error happens are the following:
- A spike on system load, if the error does not repeat, you can ignore it. To determine the frequency of the issue, from the Log Activity tab, click Add Filter and query for QID number 38750099.
- When the system is under high load persistently, the accumulator is affected. In this case, find the reason of the high load on the system and reduce it.
- When the aggregations are too complex, the accumulator is affected.
Note: This article is a troubleshooting guide that uses the graphical interface of QRadar. If you prefer the command line, follow this troubleshooting guide: QRadar: How to troubleshoot accumulator issues by using collectGvStats.sh. For more information about this notification, see Accumulator is falling behind.
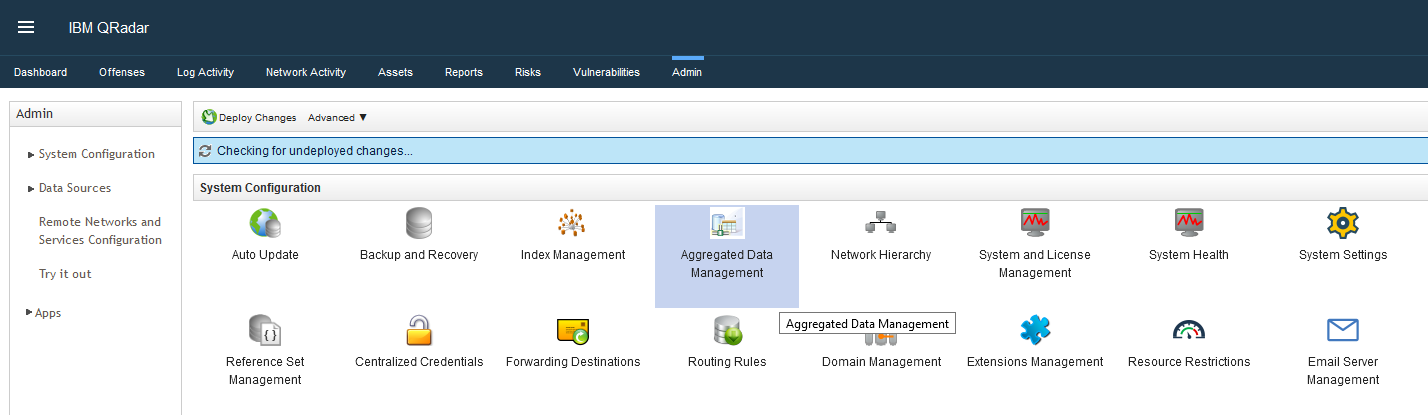
In the QRadar user interface
- Log in to QRadar as an administrator.
- Click the Admin tab.

- Select the Aggregated Data Management icon.
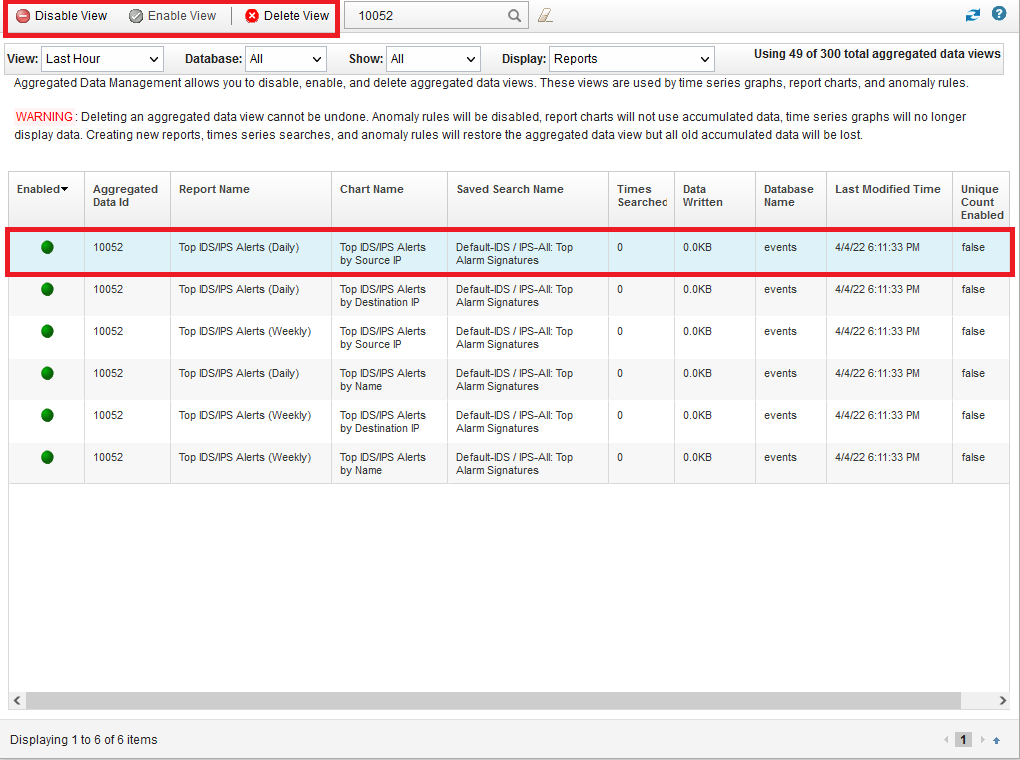
- Search the global view by using the ID from the error message:

- After you find the global view that is reported, select one of the following:
- If the view is not in use, you can disable or delete it.
- If the view is in use, you can adjust the view or the search to reduce the impact on the accumulator. You can follow this article to tune the searches,
Searching Your QRadar Data Efficiently.
Result
The error message stop showing on the GUI. Monitor the system to confirm that the issue has being resolved. If the issue reoccurs and following this guide does not correct it, contact support and report the issue and the steps you followed in this technical note.
Document Location
Worldwide
[{"Type":"MASTER","Line of Business":{"code":"LOB24","label":"Security Software"},"Business Unit":{"code":"BU059","label":"IBM Software w\/o TPS"},"Product":{"code":"SSBQAC","label":"IBM Security QRadar SIEM"},"ARM Category":[{"code":"a8m0z000000cwstAAA","label":"Accumulator"}],"ARM Case Number":"","Platform":[{"code":"PF016","label":"Linux"}],"Version":"All Versions"}]
Was this topic helpful?
Document Information
Modified date:
30 April 2022
UID
ibm16570687