Troubleshooting
Problem
In QRadar, raw events are ingested and then parsed (normalized) by the ecs-ec service. Within the ecs-ec service, the event parser threads take information from the payload and build a record by using custom event properties and patterns from the respective DSM. If these parser threads become overwhelmed and cannot handle new events as quickly as they arrive at the system, the ecs-ec service routes some events "directly to storage", bypassing the parser threads. This mechanism is designed to preserve as close to real-time processing as possible, but it is important to address the performance issue quickly as unparsed also events impacts correlation and search functionality.
Symptom
The most common way to see Performance Degradation is in the system notifications. In the bell icon a notification that says Performance degradation has been detected in the event pipeline is displayed. If you hover over the notification, the payload specifies which system is experiencing the routing to storage behavior.
In this case, we want to concentrate on routing to storage at DSM filter. This example payload mentions both DSM filter and Device Parsing.
[[type=com.eventgnosis.system.ThreadedEventProcessor][parent=:ecs-ec/EC/Parsing/DSM_Normalize]]
  com.ibm.si.ec.filters.normalize.DSMFilter: [WARN] [NOT:0080004101][-/- -]
  Device Parsing has sent a total of 18167670 event(s) directly to storage.
  593 event(s) have been sent in the last 60 seconds. Queue is at 88 percent capacity.
Cause
Routing to storage at device parsing is caused when the event parser threads in the ecs-ec service are unable to keep up with the incoming EPS rate or there is parsing configuration that is inefficient.
Performance Degradation can also be caused when the appliance is being sent more EPS then it is rated to process. This technote contains the steps to check hardware capabilities: QRadar: Matching hardware with incoming Events Per Second.
Diagnosing The Problem
To track down which hosts are seeing performance degradation at device parsing:
- Select the bell in the bell icon.
- Select the Performance degradation has been detected in the event pipeline.
- Then, to identify the appliances that are generating the most performance degradation notifications, group the search by source IP or use this AQL search:
Select sourceip as 'IP', COUNT(*) from events where qid='38750088' and utf8(payload) ILIKE '%DSMFilter%' GROUP BY IP last 24 HOURS;There often is a second notification that says "Performance degradation has been detected in the event pipeline. Expensive DSM or DSM Extensions were found".[Timer-36] com.ibm.si.ec.filters.normalize.DSMFilter: [WARN] [-/- -]Expensive Log Source or Log Source Extensions Based On Average Throughput in the last 60 seconds (most to least expensive) - Linux OS=60.0epsThis notification tells us that the Linux DSM is parsing 60 EPS currently. EPS values less than 5000 EPS are worth investigating. The notification means the event payloads need to be checked to verify that there is not an issue with the payload structure. An issue with the payload structure would cause the event parser threads to be slow and cause routing to storage.
To find these events:
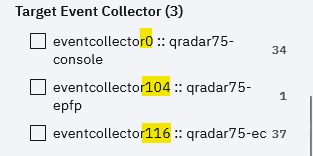
- Navigate to the Log Source Management app and under "Target Event Collector" note the ID of the event collector.
- Then, in log activity, add filters for Event Collector ID, Category is stored and stored for performance is false. Group by log source type. These results display all of the events that the DSM could not parse and causes performance issues in device parsing.

- From the search results, the criteria can be narrowed down to log source, event name, or category.
- Select a few events from your search results.
- In the Actions menu, select DSM Editor.
- After the DSM Editor loads with the event payloads, then review the parsed fields. If at minimum the event ID and category are not parsed out, then likely the payload is being auto discovered incorrectly or there is an issue with the log source configuration.
Resolving The Problem
To resolve the immediate issue, disable the log sources identified in the Diagnosing the Problem steps. When a log source is disabled, the events are sent to the SIM generic log source where there is little to no parsing. Sending the events to the SIM generic log source allows event parsing to perform better while the user works on permanently fixing the parsing issue.
Note: Make sure to disable, but not delete, the log source. If auto detection is enabled, deleted log sources can be re-created automatically.
Next Steps
- Review the DSM guide to make sure the log source is configured properly.
- Check to make sure the proper DSM is installed.
To check the version:- Browse to Admin>Auto Update>View history.
- Search for the log source type there.

- Match the DSM version to IBM Fix Central to make sure that the latest DSM is installed.
Document Location
Worldwide
[{"Type":"MASTER","Line of Business":{"code":"LOB24","label":"Security Software"},"Business Unit":{"code":"BU059","label":"IBM Software w\/o TPS"},"Product":{"code":"SSBQAC","label":"IBM Security QRadar SIEM"},"ARM Category":[{"code":"a8m0z000000cwtiAAA","label":"Performance"}],"ARM Case Number":"","Platform":[{"code":"PF025","label":"Platform Independent"}],"Version":"All Versions"}]
Was this topic helpful?
Document Information
Modified date:
03 April 2023
UID
ibm16603731