Troubleshooting
Problem
The EPS (Events Per Second) rate is one of the most important performance metrics in QRadar.
This metric is critical to assess whether a QRadar deployment is scaled and licensed correctly for the event volume received.
Licensing based on EPS rate is enforced at the ecs-ec-ingress process.
Resolving The Problem
When administrators use the default dashboard graphs in QRadar, the values for Events Per Second (EPS) might not be accurate. For example, there are conditions with Quick Search Event Rate (EPS) which does not always provide accurate results. A better metric for EPS calculations are suggested by using an AQL search or a command-line method.
Before you begin
The queries provided here have these requirements:
Results
These searches can be used for any Event Processor or Log Source Type to help with investigations of high EPS spikes or counts.
Before you begin
The queries provided here have these requirements:
- Health metrics custom properties require QRadar 7.3.3 Fix Pack 6 or 7.4.1 and later. If you use older versions of QRadar, you can query for the peak EPS rate from the command line.
- All Custom Event Properties for the Health Metrics log source must be enabled to display the incoming event rate from the ecs-ec-ingress service.
- Component Name
- Component Type
- Deployment ID
- Element
- Hostname
- Metric ID
For example, the Enabled column displays True for the Log Source Type Health Metrics.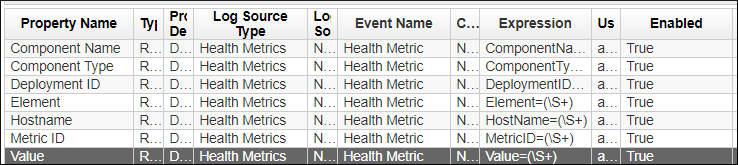
-
The command-line options require root access to the QRadar Console appliance.
Determining peak EPS by using the Advanced Log Activity search
- Log in to the QRadar Console.
- Click the Log Activity tab.
- Click Advanced Search.
- Copy and paste the AQL statement into the search box.
Note: By default, the search reports data from the last 5 minutes. If you need to extend this time frame, you can update the query to define your time frame in the user interface or touch up the query to add more time, for example LAST 6 HOURS.SELECT "Hostname" AS 'Hostname (custom)', MAX("Value") AS 'Value (custom) (MAX)', COUNT(*) AS 'Count' from events where ( "Metric ID"='EventRate' AND "deviceType"='368' ) GROUP BY "Hostname" order by "Count" desc - Click Search.
Results
The AQL query pulls peak EPS information from the Console, Event Collectors, and Event Processors. In the example, the graph is displaying a Console, an Event Processor, and peak EPS. The graph allows administrators to view whether they are exceeding their license and be able to investigate the high EPS.
Determining average EPS by using the Advanced Log Activity search
- Log in to the QRadar Console.
- Click the Log Activity tab.
- Click Advanced Search.
- Copy and paste the AQL statement into the search box.
Note: By default, the search reports data from the last 5 minutes. If you need to extend this time frame, you can update the query to define your time frame in the user interface or touch up the query to add more time, for example LAST 6 HOURS.SELECT "Hostname" AS 'Hostname (custom)', AVG("Value") AS 'Value (custom) (Average)', COUNT(*) AS 'Count' from events where ( "Metric ID"='EventRate' AND "deviceType"='368' ) GROUP BY "Hostname" order by "Count" desc - Click Search.
Results
The AQL query pulls average EPS information from the Console, Event Collectors, and Event Processors. In the example, the graph is displaying a Console, an Event Processor, Average EPS. The graph allows administrators to view when hosts exceed the licensed EPS rate and investigate EPS spikes.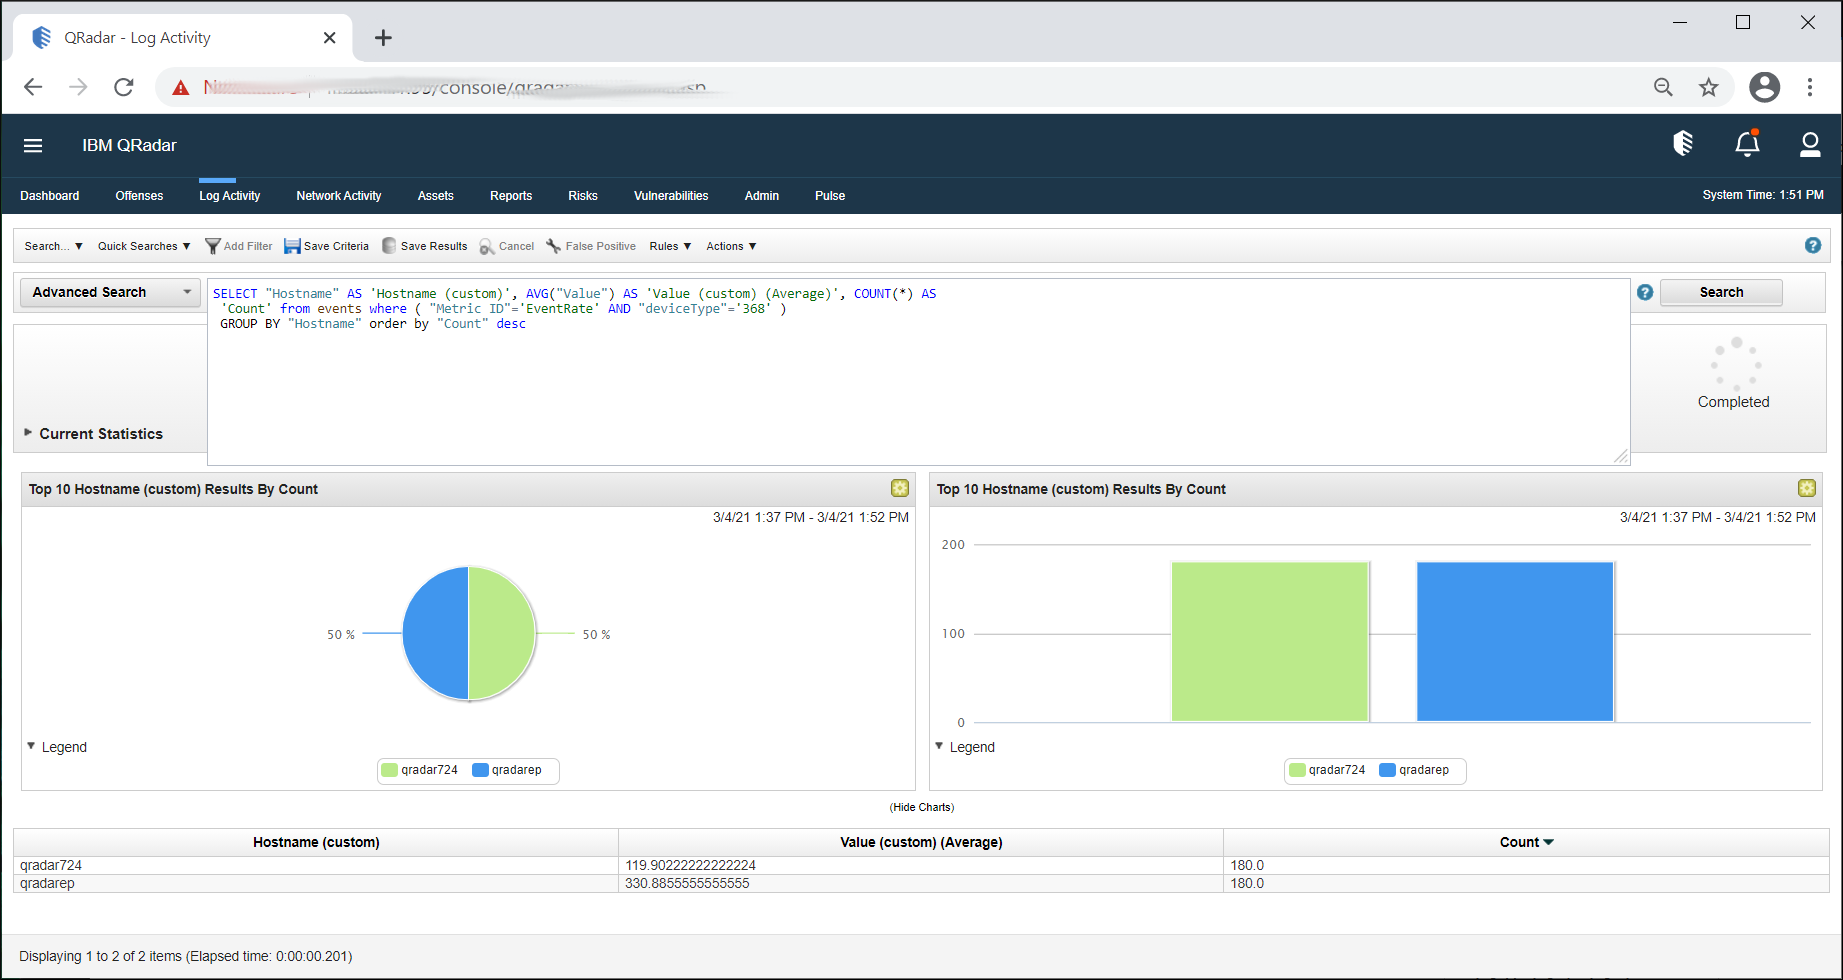
Altering Advanced Log Activity search to present Log Source volume per minute
- Log in to the QRadar Console.
- Click the Log Activity tab.
- Click Advanced Search.
- Copy and paste the AQL statement into the search box.
Note: By default, the search reports data from the last 5 minutes. If you need to extend this time frame, you can update the query to define your time frame in the user interface or touch up the query to add more time, for example LAST 6 HOURS.SELECT DATEFORMAT(starttime,'YYYY-mm-dd HH:MM') as "MyTime", LOGSOURCENAME(logsourceid) as "Log Source", count(*) as "Raw Event Count" FROM events GROUP BY "MyTime", logsourceid ORDER BY logsourceid, "MyTime" - Click Search.
Results
The AQL query pulls the sum of raw events received for each log source and displays these results ordered by Log Source and time. This output formatting allows analysts to review the event volume and identify which log sources are deviating significantly from their normal behavior.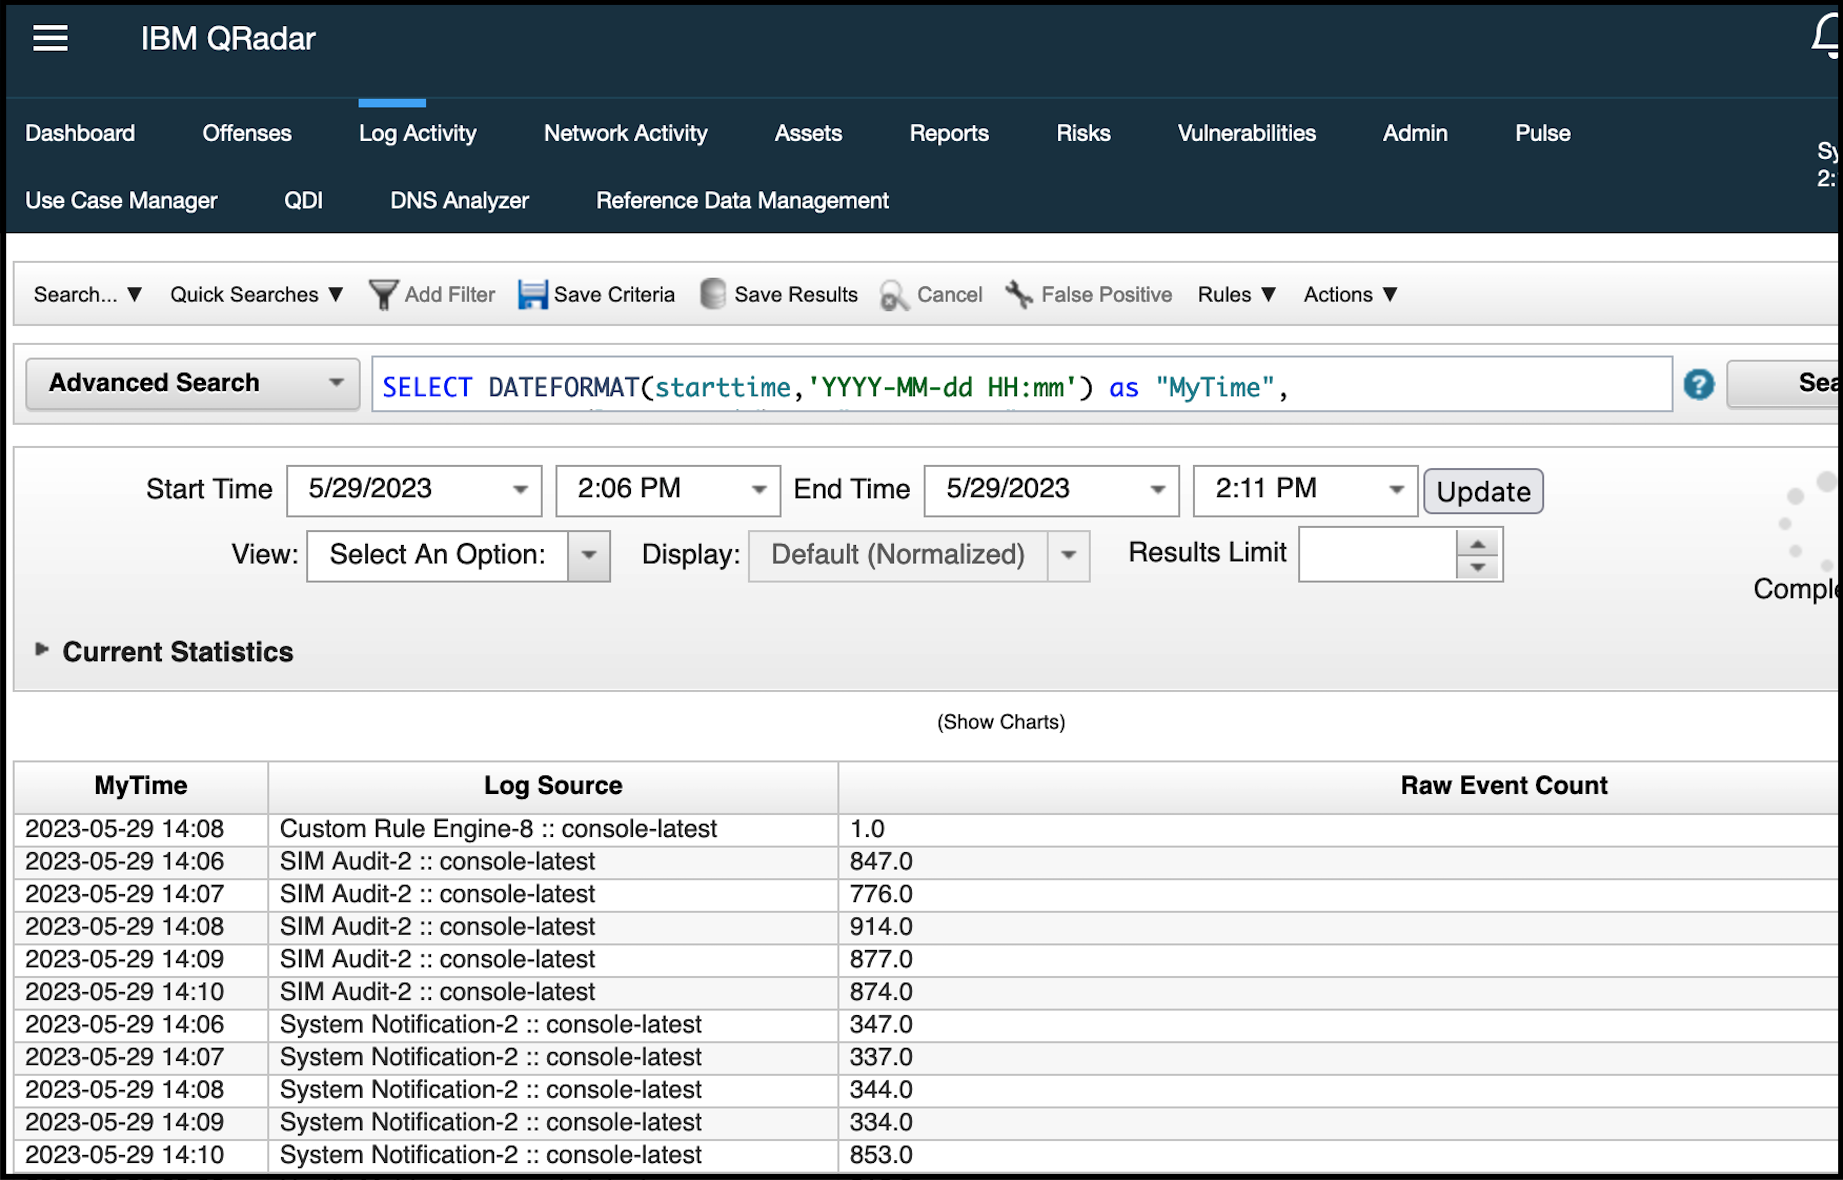
Investigating Peak EPS spikes by using Filtered searches
After you discover which Event Processor from the AQL searches have high load, administrators need to use these two filtered searches to determine:
- Which Log source Type is causing the spike.
- From the Log Source Type filter, which Log Sources are causing the highest EPS spikes.
- Which Log Source Type is causing an EPS spike
- Log in to the QRadar Console.
- Click the Log Activity tab.
- Click Add Filter.
- Use Parameter: Event Processor, Operator: Equals, Value: The Event processor from the AQL search.

- Click Add Filter.
- Click Search > Edit Search.
- Enter Time Range.
- Scroll down to Column Definition.
- In the text box, enter Log Source Type and add it to Group By.

- Add a Name for Column Layout.
- Click Save Column Layout
- Click Search.
Results A search by Log Source Type is created to further investigate EPS spikes
- Searching the Log Sources generating the highest EPS Spikes
- Use the search results from the previous search for Log Source Type.
- For the Log Source Type generating the highest event count, click Log Source (Unique Count).

- Another graph is displayed with a list of the Log Sources generating high EPS Spikes or counts.
- Click Event Name (Unique Count) to further investigate what is causing the EPS Spike.
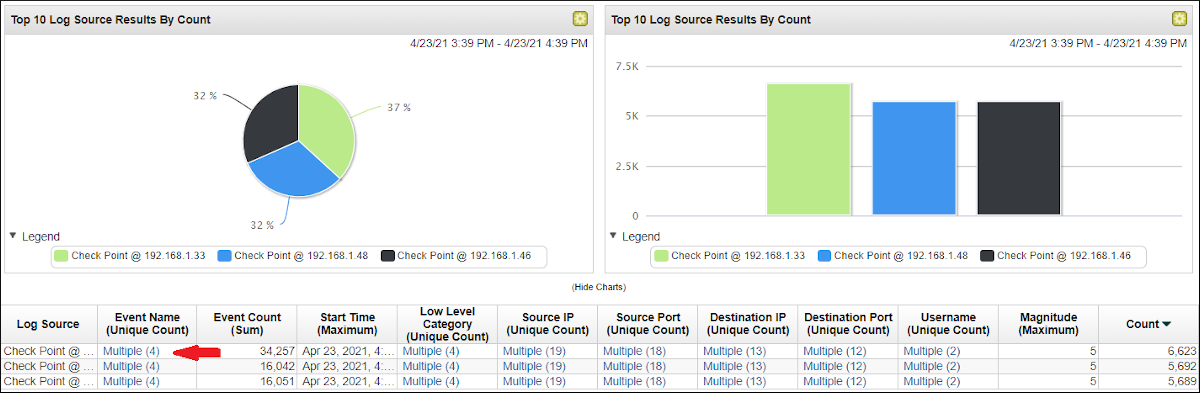
- A new graph is displayed with events that are causing high EPS spikes or counts.

Results
These searches can be used for any Event Processor or Log Source Type to help with investigations of high EPS spikes or counts.
Determining peak EPS by using the command line
The Source monitor collects the metrics from MBeans and populates the statistics in /var/log/qradar.log.
To display the metrics from the logs, use the procedure. The important things to watch in the logs are:
- Peak in the last 60s: The peak in the last minute used for tracking over license issues and spikes that cause performance issues.
- Max Seen: The maximum event rate seen the last restart of ecs-ec-ingress.
- Appliance Threshold: When we go greater than the appliance threshold, we start to use the license queue.
- Use SSH to log in to the Console as root user.
Note: QRadar on Cloud (QRoC) users can SSH to the Data Gateway appliance to view metrics for the ecs-ec-ingress service. - From the Console SSH to the appliance where you want to view your EPS.
- Type the command:
-
For QRadar versions 7.4.2 or later run use the command:
grep -i 'ecs-ec-ingress\].*SourceMonitor.*event' /var/log/qradar.log | sed -n 's/^\(.\{15\} \).*\((60s: [0-9\.]\{1,\} eps)\).*\(Peak.*60s: [0-9\.]\{1,\} eps\).*\(Appliance Threshold.*$\)$/\1 \2 \3 \4 /p'Jan 25 14:01:29 (60s: 117.73 eps) Peak in the last 60s: 128.40 eps Appliance Threshold: 5020.00 Jan 25 14:02:29 (60s: 117.57 eps) Peak in the last 60s: 127.20 eps Appliance Threshold: 5020.00 Jan 25 14:03:29 (60s: 117.47 eps) Peak in the last 60s: 128.20 eps Appliance Threshold: 5020.00 Jan 25 14:04:29 (60s: 117.52 eps) Peak in the last 60s: 127.40 eps Appliance Threshold: 5020.00 Jan 25 14:05:34 (60s: 117.53 eps) Peak in the last 60s: 127.20 eps Appliance Threshold: 5020.00 -
For QRadar 7.3.3 through 7.4.1 run the command:
grep -i 'ecs-ec-ingress\].*SourceMonitor.*event' /var/log/qradar.log | sed -n 's/^\(.\{15\} \).*\((60s: [0-9\.]\{1,\} eps)\).*\(Peak.*60s: [0-9\.]\{1,\} eps\).*\(License Threshold.*$\)$/\1 \2 \3 \4 /p'Jan 22 14:55:38 (60s: 131.32 eps) Peak in the last 60s: 140.80 eps License Threshold: 5020.00 Jan 22 14:56:38 (60s: 131.37 eps) Peak in the last 60s: 139.40 eps License Threshold: 5020.00 Jan 22 14:57:38 (60s: 131.15 eps) Peak in the last 60s: 140.00 eps License Threshold: 5020.00 Jan 22 14:58:38 (60s: 131.13 eps) Peak in the last 60s: 139.80 eps License Threshold: 5020.00 Jan 22 14:59:38 (60s: 131.30 eps) Peak in the last 60s: 140.60 eps License Threshold: 5020.00 Jan 22 15:00:38 (60s: 131.30 eps) Peak in the last 60s: 140.40 eps License Threshold: 5020.00 Jan 22 15:01:38 (60s: 131.58 eps) Peak in the last 60s: 142.00 eps License Threshold: 5020.00 Jan 22 15:02:43 (60s: 131.15 eps) Peak in the last 60s: 139.80 eps License Threshold: 5020.00
-
Results
Things to look at are Peak events in the last 60 seconds and maximum events seen since the last time ecs-ec-ingress was restarted.
To determine maximum EPS by using a MBean query
There is a hardware restriction applied on 1501, 1599, and QRadar on Cloud Data Gateways to prevent the incoming EPS rate from exceeding the capability of the hardware.
- Use SSH to log in to the Console.
- SSH to that appliance with high EPS.
- Copy the query to the command line:
/opt/qradar/support/jmx.sh -p 7787 -b 'com.q1labs.sem:application=ecs-ec-ingress.ecs-ec-ingress,type=sources,name=Source Monitor'com.q1labs.sem:application=ecs-ec-ingress.ecs-ec-ingress,type=sources,name=Source Monitor ----------------------------------------------------------------------------------------- LongWindowLengthInSecs: 900 EventImmediateWindowAverage: 118.18450125218368 FlowRate: 0.0 FlowImmediateWindowAverage: 0.0 FlowLongWindowAverage: 0.0 ImmediateWindowLengthInSecs: 300 MaximumFlowRateSinceStartup: 0.0 EPSThreshold: 5020.0 EventLongWindowAverage: 118.18450125218368 FPSThreshold: 0.0 EventRate: 145.2 MaximumEventRateSinceStartup: 254.4
Creating custom EPS graphs in the Pulse application
Before you begin
- This procedure requires the Pulse application. To download the latest version, see https://ibm.biz/pulseapp.
- If you cannot see or view data from a Pulse dashboard, contact your administrator to confirm your permissions. For more information, see Assigning user capabilities for QRadar Pulse.
Procedure
- Click the Pulse Dashboard tab.
- Click the Dashboard Configuration icon.

- Click Create new widget.
- Type a Name and Description.
- Under Data Source, select AQL.
- Set the Refresh Time to your preference.
Note: The default value for Refresh Time is 60 seconds. - Create your graph with one of the following AQL statements:
- AQL statement 1: Average EPS
SELECT "Hostname" AS 'Hostname (custom)', AVG("Value") AS 'Value (custom) (Average)', COUNT(*) AS
 'Count' from events where ( "Metric ID"='EventRate' AND "deviceType"='368' )
 GROUP BY "Hostname" order by "Count" desc
- AQL statement 2: Peak EPS
SELECT "Hostname" AS 'Hostname (custom)', MAX("Value") AS 'Value (custom) (Maximum)', COUNT(*) AS 'Count' from events where ( "Metric ID"='EventRate' AND "deviceType"='368' ) GROUP BY "Hostname" order by "Count" desc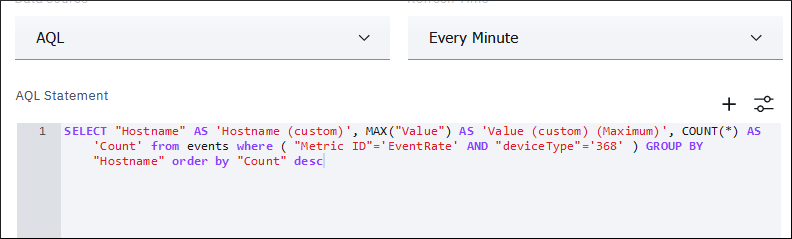
- AQL statement 1: Average EPS
- Enter a Results Limit.
Note: The default result limit is 1000. - Click Run Query.
- Under Views, create a View Name.

- Under Chart Type, select the Time Series Chart.
- Under Time (x-axis), select Value.
- Under Values (y-axis), select Hostname.

- Optional: Enable Area Chart.
Note: The default is Off. - Optional: Enable Show legend.
Note: The default is Yes. - Optional: Select Legend Orientation.
- Click Save.
- Confirm that the graph data is correct.
- Repeat the procedure to create a graph with AQL statement 2.
Results
A Dashboard Widget is created that you can add to your Pulse Dashboard.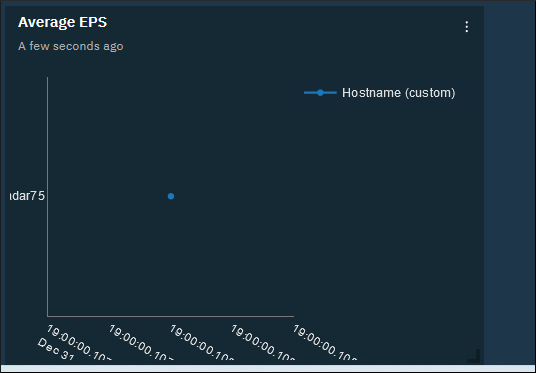
Document Location
Worldwide
[{"Type":"MASTER","Line of Business":{"code":"LOB24","label":"Security Software"},"Business Unit":{"code":"BU059","label":"IBM Software w\/o TPS"},"Product":{"code":"SSBQAC","label":"IBM Security QRadar SIEM"},"ARM Category":[{"code":"a8m0z000000cwsyAAA","label":"Admin Tasks"}],"ARM Case Number":"","Platform":[{"code":"PF025","label":"Platform Independent"}],"Version":"7.3.3;7.4.1;7.4.2;7.4.3;7.5.0"}]
Was this topic helpful?
Document Information
Modified date:
15 November 2023
UID
ibm16406002