Troubleshooting
Problem
You receive the system notification "Events/flows were dropped by the event pipeline" and want to troubleshoot it
Diagnosing The Problem
Review the payload to identify what is causing the events to be dropped.
- Click the notifications to view the alerts
- Click View All next to the notification to open a new search view.
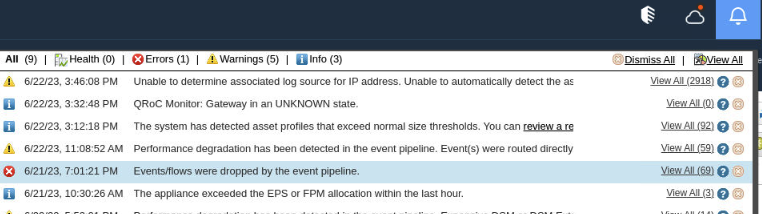
- Double-click the event that you are investigating to open its Event Details page and scroll down to view the payload
Troubleshooting this issue depends on what the payload looks like. Here are some examples:
Events being dropped as the incoming raw event rate is greater than the license limit:
[SourceMonitor-2/ecs-ec-ingress.ecs-ec-ingress] com.q1labs.sem.monitors.SourceMonitor: [WARN] [NOT:0060005100][ip/- -] [-/- -]A total of 14892 dropped raw event(s) have been detected. 14892 raw event(s) have been dropped in the last 60 seconds. License restrictions have been applied 9 times in the last 60 seconds.
Events being dropped at ECS Queue Monitor:
[ecs-ep.ecs-ep] [ECSQueueMonitor-2] com.q1labs.sem.monitors.ECSQueueMonitor: [WARN] [NOT:0060005100][ip/- -] [-/- -]ECS Queue Monitor has detected a total of 17835 dropped event(s). 17835 event(s) were dropped in the last 60 seconds. EP Queues: 17835 dropped event(s). MPC Queues: 0 dropped event(s).
Resolving The Problem
Events being dropped as the incoming raw event rate is greater than the license limit
Follow the instructions in this documentation - Event pipeline dropped events
For verifying the incoming event rate at the time that the problem occurred, refer to this documentation - Determining the Events Per Second rate for each log source in QRadar
An alternative method of checking the incoming event rate in the backend is to do the following:
- SSH to the appliance that experienced the dropped events
- Run this command to view the incoming raw EPS seen by ecs-ec-ingress:
Sample output:grep raw /var/log/qradar.log | grep -i ecs-ec.ingress | sed -n 's/^\(.\{15\} \).*\((60s: [0-9\.]\{1,\} eps)\).*\(Peak.*60s: [0-9\.]\{1,\} eps\).*\(Threshold: [0-9\.]\{1,\}\).$/\1 \2 \3 \4/p' | lessDate Time (60s: 35.93 eps) Peak in the last 60s: 120.40 eps Threshold: 5020.0 Date Time (60s: 37.03 eps) Peak in the last 60s: 120.40 eps Threshold: 5020.0 Date Time (60s: 37.82 eps) Peak in the last 60s: 120.40 eps Threshold: 5020.0 Date Time (60s: 37.80 eps) Peak in the last 60s: 120.40 eps Threshold: 5020.0 - Navigate the output from the previous command to the time when events were dropped to view the spikes of EPS
- Verify whether the incoming event rate is expected and if not, review the log source responsible for generating the spike of events by following this documentation.
Events being dropped at ECS Queue Monitor
Extra steps need to be done to identify where ECS Queue Monitor detected a drop of events. Create the following search and set the search time frame to include 5 minutes before and after the Start Time of the dropped event payload:
Event Name is any of [Warning Message or Event pipeline dropped events]
Payload Contains is ecsqueuemonitor
Log Source is System Notification
Or alternatively use the following AQL query (Note: it is configured to run on the last 3 days):
select QIDNAME(qid) as 'Event Name',logsourcename(logSourceId) as 'Log Source',DATEFORMAT(starttime,'yyyy-MM-dd hh:mm')AS 'Start Time',"sourceIP" as 'Source IP', UTF8(payload) as "Payload" from events where ( logSourceId='65' AND (qid='38750002') or (qid='38750060') ) AND icu4jsearch('ecsqueuemonitor', payload) != -1 order by "startTime" desc LIMIT 1000 last 3 DAYS
Example output:
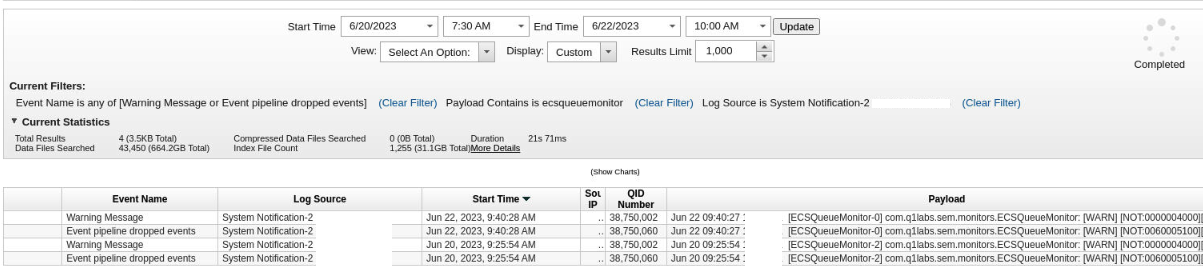
Review the payload that shows up for the "Warning Message" event that pairs with the "Event pipeline dropped events" event based on the Start Time. In the following example we can tell that RefDataDestination is where the events were dropped:
[ecs-ep.ecs-ep] [ECSQueueMonitor-2] com.q1labs.sem.monitors.ECSQueueMonitor: [WARN] [NOT:0000004000][ip/- -] [-/- -]EP Queue [RefDataDestination] has detected 18120 dropped event(s) in the last 60 seconds and is at 0 percent capacityRefDataDestination portion of the pipeline is where elements are being added to or removed from a Reference Set as part of a rule's Rule Response configuration. This payload typically means that there are too many rules that are configured to interact with a Reference Set or one of those rules is firing often.
Review the rules that use this criteria, checking to see whether the rules need to stay enabled. If the rule is required to stay enabled, then a Rule Response Limiter can be added to control the frequency that it triggers.
The following commands can be run in the backend to pull a list of enabled rules with reference set or reference data responses but no response limiters:
1. psql -U qradar
2. select (xpath('/rule/name/text()',rule_data::text::xml))[1]::text as RuleName, unnest(xpath('//referenceDataResponse',rule_data::text::xml)) as ReferenceDataResponse, unnest(xpath('//referenseSetResponse',rule_data::text::xml)) as ReferenceSetResponse from custom_rule where not xpath_exists('//limiter',rule_data::text::xml) and xpath_exists('/rule[@enabled="true"]',rule_data::text::xml) and (xpath_exists('//referenseSetResponse',rule_data::text::xml) or xpath_exists('//referenceDataResponse',rule_data::text::xml)) order by 1;
If the problem still persists, contact support and include a set of logs from the affected appliance.
Document Location
Worldwide
[{"Type":"MASTER","Line of Business":{"code":"LOB24","label":"Security Software"},"Business Unit":{"code":"BU059","label":"IBM Software w\/o TPS"},"Product":{"code":"SSBQAC","label":"IBM Security QRadar SIEM"},"ARM Category":[{"code":"a8m0z000000cwtiAAA","label":"Performance"}],"ARM Case Number":"","Platform":[{"code":"PF025","label":"Platform Independent"}],"Version":"All Versions"}]
Was this topic helpful?
Document Information
Modified date:
29 June 2023
UID
ibm17006447