How To
Summary
The Linux® OS DSM for IBM® QRadar® is designed to parse Linux operating system events. Events from other applications installed on top of a Linux system might be incorrectly identified and parsed as Linux OS events. Depending on the average event rate, incorrect payloads can reduce parsing performance, accuracy of log analysis and correlation.
It is more common to see this behavior for log sources or applications for which no available DSM exists. Correctly tuning log sources to handle those events can improve parsing performance.
Objective
Environment
Steps
How to identify these events
- Log in to the QRadar UI.
- Click the Log Activity tab.
- To create the First filter.
- Click Add Filter.
- For Parameter: choose Log Source Type (Indexed) > For Operator: choose Equals > For Value: choose Linux OS.
- Click Add Filter.
- To create the Second filter.
- Click Add Filter.
- For Parameter: choose Stored For Performance > For Operator: choose Equals > For Value: add False.
- Click Add Filter.
- To Create the Third Filter.
- Click Add Filter.
- For Parameter: choose Category (Indexed) > For Operator: choose Equals > For Value: choose High Level Category unknown > choose Low Level Category Stored.
- Click Add Filter.
The last filter is the most important because events can be categorized as stored for two reasons, either there are performance degradation issues or they cannot be parsed due to the nature of the payload. The second filter, "Stored For Performance" is False, displays only events that need to be addressed.

- Use the search created.
- From View select or add a time interval.
- From Display select Source IP
- Click the Gear to expand Top 10 Source IP Results by count.
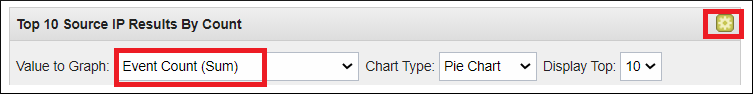
- Change the Value to Graph from Count to Event Count (Sum)
Note: The log sources getting the most traffic are at the top. If their event count is significantly greater that the other log sources, then focus on them as they cause the more impact on performance. - Double-click the top Source IP to open events only from that source.
- Set the Display Filter to "Raw Events" in order to more easily see what type of payloads you are getting. The service name generating the events is usually after the hostname or IP address. Identifying the service name is useful as with that information you can tell if the events either:
- Belong to a different log source type for which a DSM exists.
- There is no DSM and a custom one needs to be created.
- They are unwanted events.
- Repeat step #6 for other the other top log sources in the list.
Check the event parsing statistics
- Use the Search created.
- Click Search > Edit Search.
- Scroll to Available Columns.
- Search for "Event Processor" and move it to the Group By: section.
- Search for "Event Collector ID" and move it to the Group By: section.
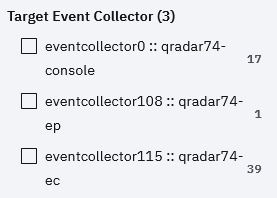
- Click Search. The results include the Event Processor name and the Event Collector ID.

- To easily map the Event Collector's ID with its name, go to the Log Source Management App, and in the left column the Event Collector names and IDs are displayed. In the image, eventcollector115 corresponds to the host with name qradar74-ec
- Open an SSH session into the identified Event Collector and collect parsing statistics by using:
/opt/qradar/support/jmx.sh -p 7777 -b "com.q1labs.sem:application=ecs-ec.ecs-ec,type=filters,name=DSM,id=LinuxServer"
The parsing statistics give an idea of how slow or fast is the parsing on the Linux DSM. Be careful as the output is different on different collectors. It is important to correctly identify the Event Collector.
Note: On a QRadar on Cloud deployment, you can do this only on the Data Gateways./opt/qradar/support/jmx.sh -p 7777 -b "com.q1labs.sem:application=ecs-ec.ecs-ec,type=filters,name=DSM,id=LinuxServer" com.q1labs.sem:application=ecs-ec.ecs-ec,type=filters,name=DSM,id=LinuxServer ----------------------------------------------------------------------------- AverageEventParseTimeInMilliSecs: 0.4618693719426812 EventsReceived: 4,889,237 EventsParsedCount: 4,892,563 EventsNormalizedProperly: 1,360,424 EventsUnrecognized: 3,519,800
The variable
AverageEventParseTimeInMilliSecs varies between log source types. Lower parsing times mean more efficient parsing. In this case, 0.46 ms per event is a high value indicating that this DSM is only able to process events at about 2,173 EPS. In the example, the high proportion of Unrecognized Events to Events Normalized Properly indicates the high average parse time is probably an effect of seeing events that do not match this DSM.How to fix these events
- If another log source is already configured with the correct type, then check the Parsing order. Refer to QRadar: The use of Parsing orders.
- If all events are from a different log source type, then change the type directly from the "Log Source Managment" app
Do not create a routing rule to drop these events because routing rules require events to be parsed first in order to drop them.
Refer to the QRadar DSM guide on how to configure the Log Source for supported events.
Opening a case with support
If the issue seems to be different from what is described in this article or you need other assistance identifying the problem, you can open a case with support. To speed up the process, run these commands on the QRadar managed host seeing the performance issue and upload the generated files to the new case:
- for i in {1..5}; do /opt/qradar/support/threadTop.sh p 7777 --full >> ecs-ec-threads_$(hostname -s).txt; done
- The output file is ecs-ec-threads_*.txt
- /opt/qradar/support/findExpensiveCustomProperties.sh
- This command runs for ~ 2 minutes and generates a file named CustomProperties-*.tar.gz
- /opt/qradar/support/dumpDSMInfo.sh
- This command generates a file named ecs-mbeans.tgz
Document Location
Worldwide
Was this topic helpful?
Document Information
Modified date:
20 September 2021
UID
ibm16475721