Troubleshooting
Problem
Customer is using an IBM Cognos Planning Analytics. They are encountering an issue when using a component (for example PAW) which runs inside a web browser.
How can they generate a HAR file to troubleshoot web-browser-based issues with Planning Analytics?
Cause
HAR files ("Http ARchive") are a JSON-formatted archive file format for logging a web browser's interaction with a site.
- Typically, they are useful in troubleshooting performance problems (and errors) when using web-based software (such as PAW).
Resolving The Problem
The steps vary, depending on the web browser that the user is using.
Chrome
1. Launch Google Chrome.
2. In Chrome, go to the page where you are experiencing trouble
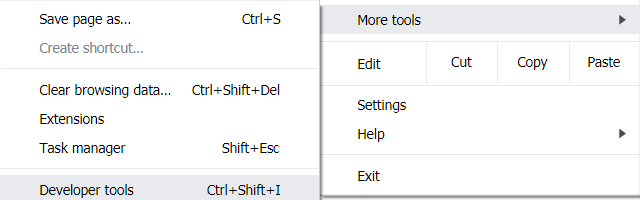
3. Select the Chrome menu (⋮) at the top-right of your browser window, then select More Tools > Developer Tools.
1. Launch Google Chrome.
2. In Chrome, go to the page where you are experiencing trouble
3. Select the Chrome menu (⋮) at the top-right of your browser window, then select More Tools > Developer Tools.
4. The Developer Tools will open as a docked panel at the side or bottom of Chrome. Click on the Network tab.
5. Tick/select the option Preserve log (see below):
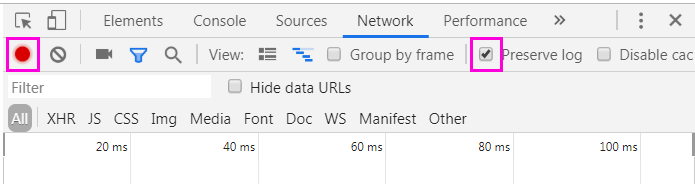
6. The recording should autostart and you will see a red circle at the top left of the Network tab (see above).
If not, click the black circle, to start recording activity in your browser.
7. Refresh the web page that you are on
7. Refresh the web page that you are on
- Perform the task which is causing the issue
- The goal is to reproduce the problem you've been experiencing while Google Chrome is recording activity.
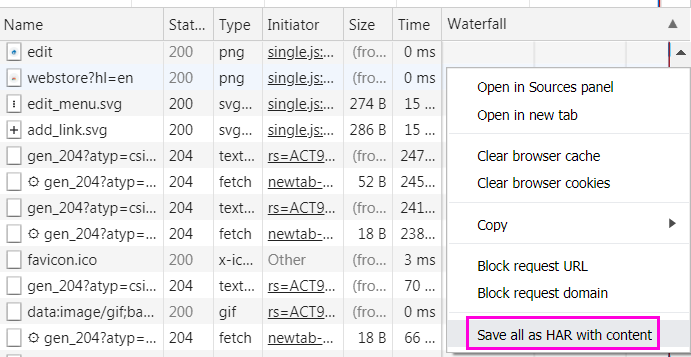
8. Once you have reproduced the problem (while recording), right-click within the Network tab and click Save as HAR with Content to save a copy of the activity that you recorded:
8. Once you have reproduced the problem (while recording), right-click within the Network tab and click Save as HAR with Content to save a copy of the activity that you recorded:
9. Save the HAR file somewhere convenient.
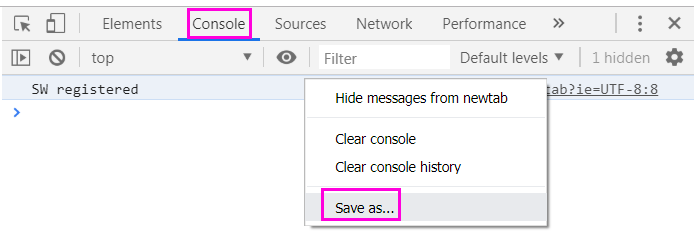
10. Now click the Console tab and right-click anywhere in the console log. Select the popup option "Save as..." and name the log file something sensible:
11. Close the developer panel.
12. Typically, the customer will now upload the two files (especially the HAR file) into their support case.
Firefox
1. Launch Firefox.
2. In Firefox, go to the page where you are experiencing trouble.
3. Select the Firefox menu (Three horizontal parallel lines) at the top-right of your browser window, then select Developer > Network.
4. The Developer Network Tools will open as a docked panel at the side or bottom of Firefox. Click on the Network tab.
- Before starting the capture, be sure to enable the setting: Enable persistent logs in the Toolbox Options > Common Preferences (click on gear icon on the Toolbox toolbar to open the Toolbox Options pane)
- Click on the Network tab after setting the option.
5. The recording will autostart once you start performing actions in the browser.
6. Refresh the web page that you are on
5. The recording will autostart once you start performing actions in the browser.
6. Refresh the web page that you are on
- Perform the task which is causing the issue
- The goal is to reproduce the problem you've been experiencing while Firefox is recording activity.
7. Once you have reproduced the issue and you see that all of the actions have been generated in the Developer Network Panel (this should just take a few seconds), right-click anywhere under the "File" column and click on "Save All as Har"
8. Save the HAR file somewhere convenient and close the developer panel.
9. Typically, the customer will now upload the HAR file into their support case.
Internet Explorer (IE)
8. Save the HAR file somewhere convenient and close the developer panel.
9. Typically, the customer will now upload the HAR file into their support case.
Internet Explorer (IE)
We shall use Microsoft F12 Developer Tools and the Network Tool to capture the browser headers. Then export the captured traffic as HAR file (or XML if using older version of IE).
1. Launch Microsoft Internet Explorer.
2. Press the F12 key on your keyboard. This should open the Developer Tools panel in IE. If not, find it on the browser menu: F12 Developer Tools
3. In the Developer Tools panel, click the Network panel and then deselect the Clear entries on navigate option. (on by default).
4. Click the Network panel/button and then the Start Capturing button (or press Ctrl + E). Note: the icon looks like a green triangle
5. Click the IE Refresh button. The goal is to reproduce the problem you've been experiencing while IE is recording activity
6. The Developer Tool panel should now show a list of the URLs that are included in the page you have in your browser.
7. Click the Stop button when the issue has been reproduced (or press Ctrl + E). Note: the icon looks like a red square
8. Click the Export captured traffic icon and save the file somewhere convenient (or press Ctrl + S). Note: the icon looks like a floppy disk.
9. Typically, the customer will now upload the HAR file into their support case.
10. Click on the Console tab and look for any errors/warnings reported. If errors are shown, please right-click on the console errors and select Copy all or send a screenshot of them.
11. Close the Developer Tools panel.
Related Information
Document Location
Worldwide
[{"Business Unit":{"code":"BU059","label":"IBM Software w\/o TPS"},"Product":{"code":"SSD29G","label":"IBM Planning Analytics"},"Component":"","Platform":[{"code":"PF033","label":"Windows"}],"Version":"All Versions","Edition":"","Line of Business":{"code":"LOB10","label":"Data and AI"}}]
Was this topic helpful?
Document Information
Modified date:
20 September 2021
UID
ibm10878889