Troubleshooting
Problem
Symptom
- ナビゲーション・メニューで、「管理」をクリックします。
- 「システム構成」のセクションで、「システムおよびライセンス管理」をクリックします。
- 「表示」リストから、「ライセンス」を選択します。
- 「ライセンス・プール管理」をクリックします。
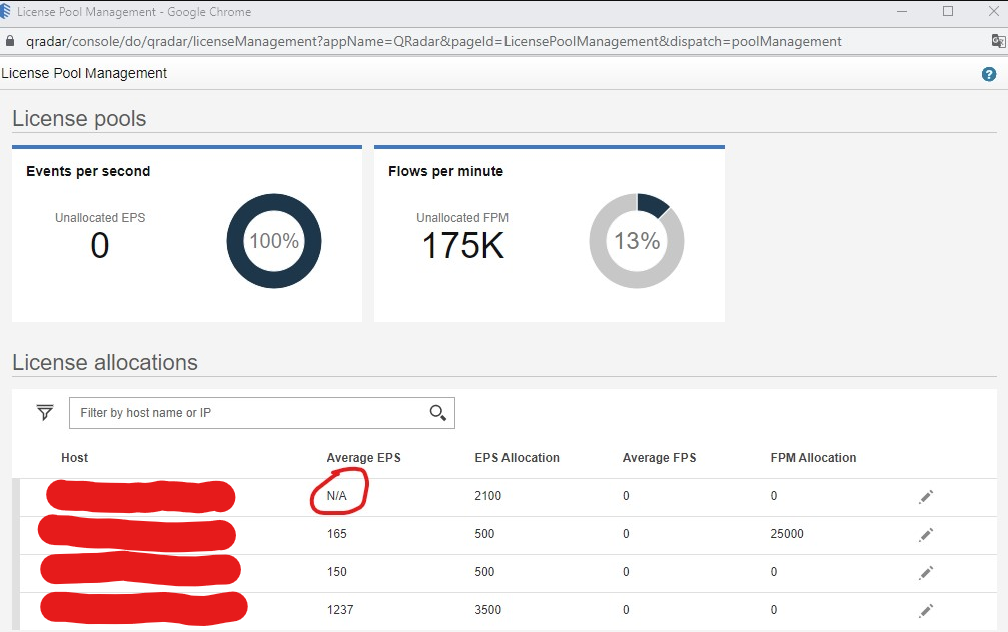
- 以下のように、平均 EPS 値が「N/A」のホストが 1 つ以上表示されます。
/var/log/qradar.error で以下のようなエラーが確認される場合があります。
grep -i accumulator /var/log/qradar.error
[accumulator_rollup.accumulator_rollup] [accumulator_rollup.accumulator_rollup] com.q1labs.frameworks.core.ThreadExceptionHandler: [ERROR] [NOT:0000003000][{CONSOLE}/- -] [-/- -]Exception was uncaught in thread: accumulator_rollup.accumulator_rollup
[accumulator_rollup.accumulator_rollup] [accumulator_rollup.accumulator_rollup] java.lang.NullPointerException
(..)
[accumulator.accumulator] [AccumulationService] com.q1labs.cve.accumulation.AggregationService.events: [ERROR] [NOT:0000003000][{CONSOLE}/- -] [-/- -]Unable to create aggregator for view:10058 [accumulator.accumulator] [AccumulationService] java.lang.NullPointerException
Cause
- アキュムレーターのメモリーまたは時間の不足
- ホストに割り当てられた CPU の不足
- hosts ファイルが正しくない
- 保存済み検索のイベント・レート ( EPS ) またはフロー・レート ( FPS ) の欠落、リンクの破損
- 既存検索に干渉する重複検索の作成
- 重複検索による、既存検索の変更
Resolving The Problem
- アキュムレーターのパフォーマンス が問題になっていないことを確認してください。
- コンソール上の
/etc/hostsファイルや/etc/hosts.defaultを確認してください。- hosts ファイル内で、「N/A」と表示されている該当ホストの IP は一つになっていますか?
- ホストのショート・ネームは、IP アドレスと同じ行にありますか?
- ホストの完全修飾ドメイン名 ( FQDN ) は IP アドレスと同じ行にありますか?
注: 「管理」>「システムおよびライセンス管理」>「表示: ライセンス」>「ライセンス・プール管理」を閉じて再度開くことにより、問題が解決されるかどうかを確認してください。 - 場合によっては、アルゴリズムを完了するための十分な CPU リソースがシステムにないことがあります。SAR Sentinel: threshold crossed の通知や、/var/log/qradar.error における以下のようなエラーを確認する場合があります。
grep -i sarsentinel /var/log/qradar.error | less +G
[hostcontext.hostcontext] [Thread-205] com.q1labs.hostcontext.sar.SarSentinel: [WARN] [NOT:0150124100][{HostIP}/- -] [-/- -]System load over 1 minute has an average of 11.5 over the past 5 intervals, and has exceeded the configured threshold of 10.8.
CPU コアを最小コアから 推奨コア に増やします。 例えば、EP VM 8 CPU コアを 24 コアに増やします。
注: 「管理」>「システムおよびライセンス管理」>「表示: ライセンス」>「ライセンス・プール管理」を閉じて再度開くことにより、問題が解決されるかどうかを確認してください。
回避策: 現在の EPS レートが必要な場合は、以下のようにコンソールの CLI からレートを取得します。
/opt/qradar/support/all_servers.sh -C 'grep -i "Incoming raw event rate" /var/log/qradar.log | tail -n 2'
ログに対する grep コマンドは、ご使用の環境内のすべてのサーバーについて、5 秒、10 秒、15 秒、30 秒、60 秒 ( 1 分)、300 秒 ( 5 分)、および 900 秒 ( 15 分) の正確な平均値を返します。
Related Information
QRadar: Using the all_servers.sh command
QRadar: How to troubleshoot peak Events Per Second
IJ36281: 'GLOBALVIEW' AQL (ADVANCED SEARCH) FUNCTION CAN SOMETIMES FAIL TO RETU…
IJ45597: QRADAR HEALTH METRICS 'VALUE' CUSTOM EVENT PROPERTY CAN FAIL TO PARSE …
QRadar: License pool allocation displays N/A for one or more hosts
Document Location
Worldwide
Was this topic helpful?
Document Information
Modified date:
08 November 2023
UID
ibm17015813