Question & Answer
Question
When my event collector is set to send data at a specific rate (KB/s), is there a way to tell what the actual transfer rate is from the appliance to know that I am not exceeding my restriction?
Answer
To understand the current event rate, the administrator can monitor the appliance via GUI by using the QRadar Deployment Intelligence (QDI) app.
Procedure
Procedure
- Log in to the console.
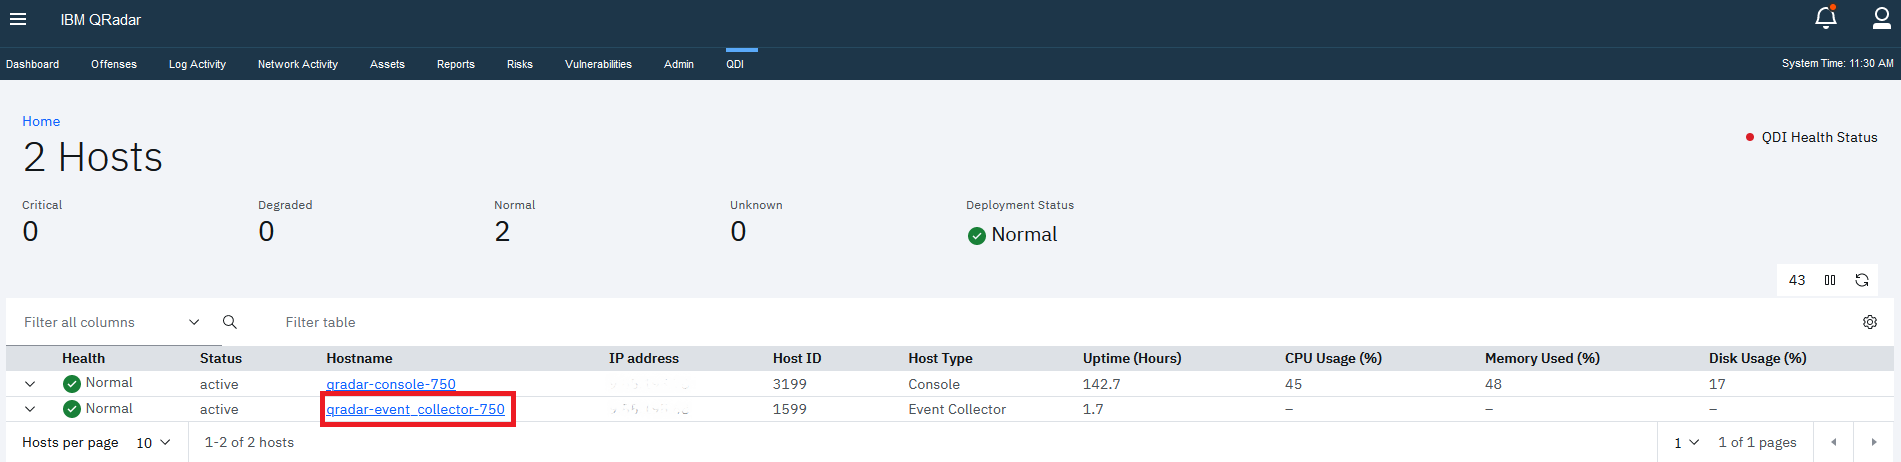
- In menu bar, select the QRadar Deployment Intelligence (QDI) option

- On the QDI dashboard, select the Event Collector you want to review
- In the Dashboard for the Event Collector, you can monitor the transfer rate
 To find the network information scroll to the end of the Dashboard, where you can find the network usage:
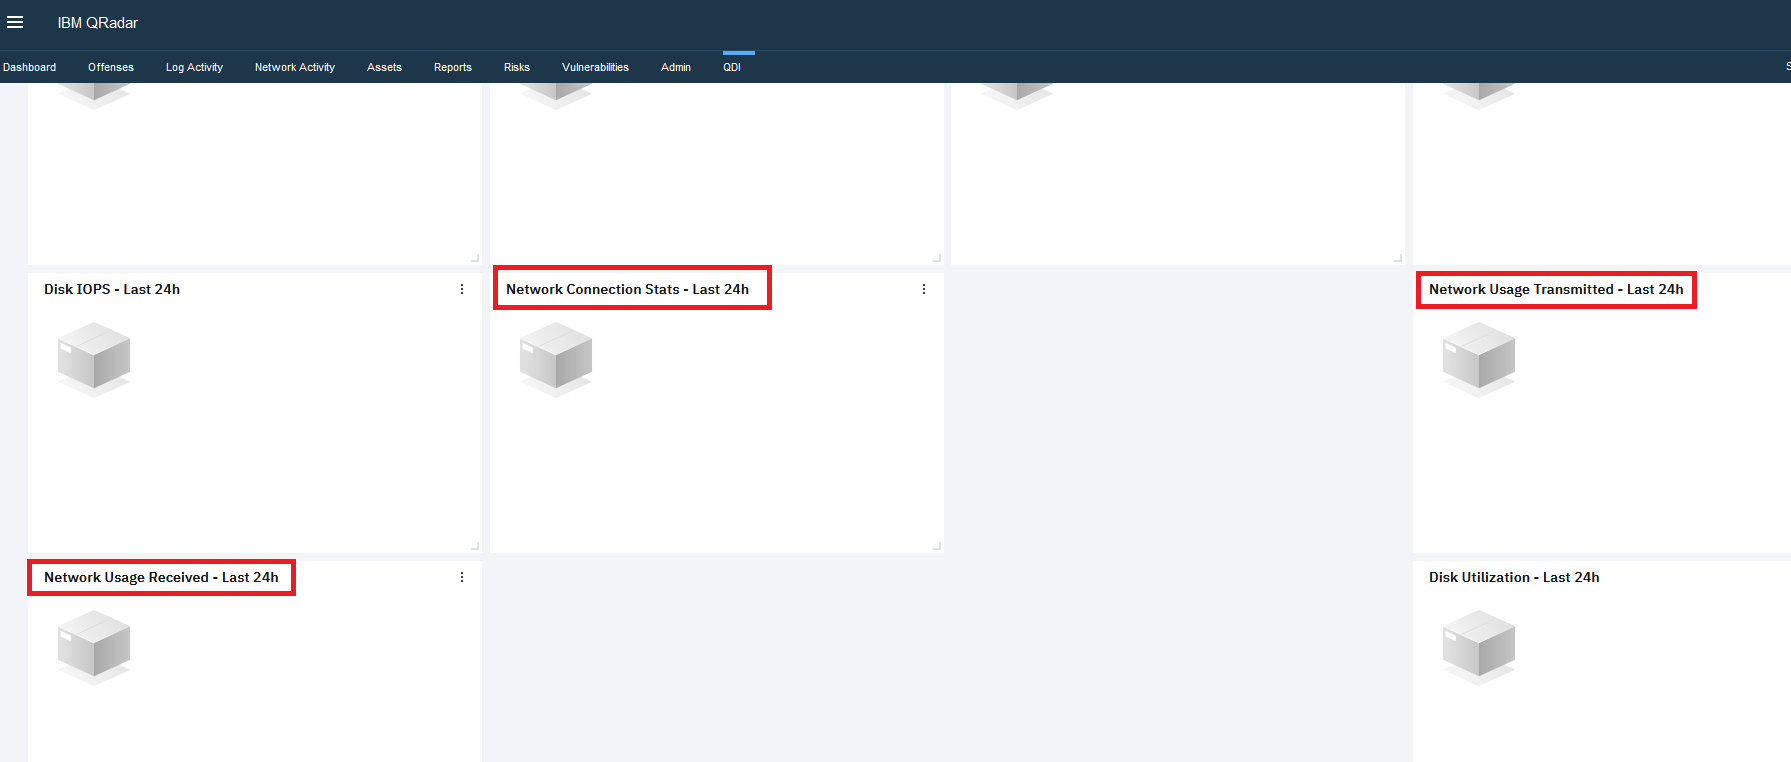
For more information about bandwidth requirements for an event collector, read the documentation:
Bandwidth for managed hosts
Bandwidth for managed hosts
Related Information
[{"Type":"MASTER","Line of Business":{"code":"LOB24","label":"Security Software"},"Business Unit":{"code":"BU059","label":"IBM Software w\/o TPS"},"Product":{"code":"SSBQAC","label":"IBM Security QRadar SIEM"},"ARM Category":[{"code":"a8m0z000000cwtiAAA","label":"Performance"}],"ARM Case Number":"","Platform":[{"code":"PF016","label":"Linux"}],"Version":"7.5.0"}]
Was this topic helpful?
Document Information
Modified date:
22 June 2023
UID
ibm16991731