Troubleshooting
Problem
Administrators might find that events received successfully by a QRadar on Cloud Data Gateway (DG) do not display in the Log Activity or Network Activity tab despite the host being reachable and succeeding when a configuration deploys completes.
If the DG cannot establish a connection to the Processor in the next stage of the event pipeline, it buffers events while it waits for a server port. If you do not see events that are received by the Event Collector when you search from the Console, you can confirm if the following error occurred: StoreForwardDestination(ecs-ec/EC/TCP_TO_EP): [-/- -]Unable to connect to server.
Symptom
The following are common symptoms when the issue occurs:
- The events no longer display in the Log Activity tab for events received by the recently added Data Gateway.
- The Data Gateway's persistent queue keeps growing as the received events are stored temporarily there. This condition triggers a disk space alert for the Data Gateway's /store partition when it passes the warning threshold.
Note: When no action is done by the administrator, the /store partition grows up until it reaches the 95%, and critical services are stopped.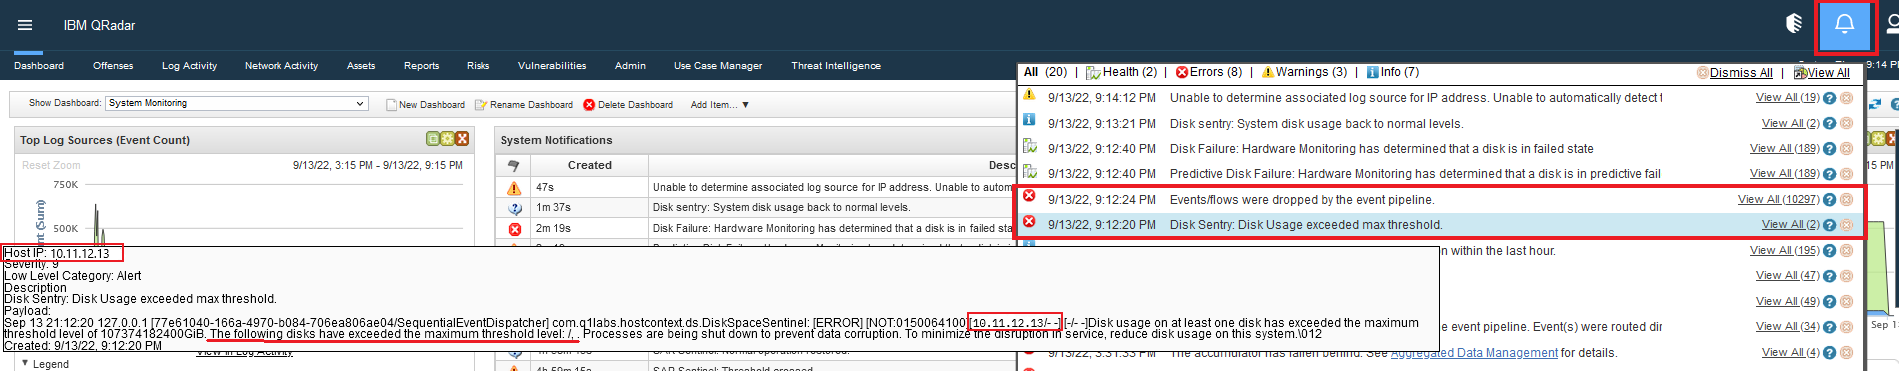
Cause
When a Data Gateway is added to a deployment, the addition script runs several API calls independently. When the API calls fail, some configurations such as the host's connection encryption settings might be left unconfigured. The encryption setting is mandatory in QRadar on Cloud deployments.
The Data Gateway missing the encryption setting fails to establish the connection between the ecs-ec service and the ecs-ep service in the Console or Processor. This failed connection causes the events not to show in the Log Activity or Network Activity.
Environment
QRadar on Cloud Data Gateways.
Diagnosing The Problem
The following steps guide administrators to determine when the host's connection encryption settings are not configured.
- Log in to the QRadar on Cloud Console user-interface as an administrator user.
- Click the cloud icon in the upper right of the Console's GUI. The Data Gateway shows as UP.
- SSH to a Data Gateway in the deployment as the root the user. To enable SSH to Data Gateway, see the section "Data Gateway(DG) Administration" in the QRadar on Cloud FAQ.
- Review the /var/log/setup-xxxx/setup_qradar_host.log and verify whether failed API calls are reported.
grep 'API call failed' /var/log/setup-xxxx/setup_qradar_host.logOutput example:(UTC) [INFO] API call failed ((GET /, attempt 1): [Failed to established connection to server: HTTPSConnectionPool(host='console-xxxxx.qradar.ibmcloud.com', port=443): Max retries exceeded with url: /api/ (Caused by NewConnectionError('<requests.packages.urllib3.connection.VerifiedHTTPSConnection object at 0x7f3bf6cf9eb8>: Failed to establish a new connection: [Errno 101] Network is unreachable',))], [ This exception occurs when the client has been unable to connect to the host provided, but is not due to a timeout],[None] Aborting - Review the /opt/qradar/conf/deployment.xml in the Data Gateway and verify the encryption setting.

Result
The Data Gateway encryption settings are now known.
Resolving The Problem
To resolve the problem, administrators must re-create the connection settings from the QRadar Self-Serve app and deploy the configuration.
- Log in to the QRadar on Cloud Console user-interface as an administrator user.
- Select the target processor of your preference. For the detailed procedure, see Editing a target processor for your data gateway.
- Click the Admin tab, and deploy the changes.
- Wait until the configuration changes process finishes.
- Verify the connection between the ecs-ec and ecs-ep components in the file /var/log/qradar.log of the DG shows: TCP Destination [ecs-ec/EC/TCP_TO_EP] is alive.
[ecs-ec.ecs-ec] [ECS Runtime Thread] com.ibm.si.ec.destinations.StoreForwardDestination(ecs-ec/EC/TCP_TO_EP): [INFO][-/- -]Parameters - server: localhost:32005, write timeout: 10000, retry attempts: 3
[ecs-ec.ecs-ec] [ECS Runtime Thread] com.q1labs.sem.monitors.TCPDestinationStatusMonitor: [INFO] [-/- -]TCP Destination [ecs-ec/EC/TCP_TO_EP] registered.
[ecs-ec.ecs-ec] [ECS Runtime Thread] com.eventgnosis.ecs: [INFO][-/- -]"qr-datagateway01.test.local:ecs-ec/EC/TCP_TO_EP" THREAD started.
[ecs-ec.ecs-ec] [ecs-ec/EC/TCP_TO_EP:TakeFromQueue] com.q1labs.sem.monitors.TCPDestinationStatusMonitor: [INFO][-/- -]TCP Destination [ecs-ec/EC/TCP_TO_EP] is alive.
Result
Administrators can now click the Log Activity and see the events received by the conflicting Data Gateway displayed. If the events are not displayed, a restart of the ecs-ec-ingress and ecs-ec services in the Data Gateway might be required. For more information about the impact of restarting these services, see this technical note. If the problem persists after the restarts, contact QRadar Support for assistance.
Administrators can now click the Log Activity and see the events received by the conflicting Data Gateway displayed. If the events are not displayed, a restart of the ecs-ec-ingress and ecs-ec services in the Data Gateway might be required. For more information about the impact of restarting these services, see this technical note. If the problem persists after the restarts, contact QRadar Support for assistance.
Related Information
Document Location
Worldwide
[{"Type":"MASTER","Line of Business":{"code":"LOB24","label":"Security Software"},"Business Unit":{"code":"BU059","label":"IBM Software w\/o TPS"},"Product":{"code":"SSKMKU","label":"IBM QRadar on Cloud"},"ARM Category":[{"code":"a8m0z000000cwtNAAQ","label":"Deployment"}],"ARM Case Number":"","Platform":[{"code":"PF025","label":"Platform Independent"}],"Version":"All Versions"}]
Was this topic helpful?
Document Information
Modified date:
24 March 2023
UID
ibm16965784