How To
Summary
The idea of this technote is to show how to create performance graphs out of SOAR logs with excel that can be of help for a better and easier interpretation of performance behavior in SOAR, which will improve and ease the analysis of multiple performance issues.
Objective
The idea of this technote is to show how to create performance graphs out of SOAR logs with excel that can be of help for a better and easier interpretation of performance behavior in SOAR, which will improve and ease the analysis of multiple performance issues.
Steps
-When it comes to isolating performance issues in SOAR there are two relevant behaviors to consider:
- Slow Response times.
- High Resource usage.
Now, SOAR generates logs that reflect resource usage and as well response times, but in terms of data interpretation logs cannot be as friendly as we expect as details are all over the entire log file.
The good news is that we can export these logs data or commands outputs into an excel sheet and then convert these into graphs that can help us interpret the data in a simple way and identify the timestamps where a relevant behavior occurred such as the slowest response times for a call or moments with higher utilization of resources. Among the logs SOAR generates that can help us identify performance issues we can consider the following:
- Slow response times:
usr/share/co3/logs/client_access_log<YYYY-MM-DD>.log - High resource utilization:
/usr/share/co3/logs/monitoring.log
/var/log/resilient-scripting/resilient-scripting-monitoring.log
SECTION I. Organizing data from file "/usr/share/co3/logs/client_access_log<YYYY-MM-DD>.log".
(The following part of the article would apply if you are looking to get the slowest response times graphed and not resource utilization).
If you are looking to get the times with the slowest response times in a day you need to work with the client_access.log file but first, you need to run a command on the file in question to get outputted data capable of being pasted into excel. First, follow these steps:
- On CLI from the customer's environment or from ECUREP's backend run the following command to the client_access.log file you want to get the slowest response times from:
(FILE=<client_access_log.2022-10-14.log>; awk "{if (\$11>=$(awk '{ if ($11 > 5000) { print $11 }}' $FILE | sort -n -r | head -100 | tail -1)) { print \$4, \$6, \$7, \$11 }}" $FILE) - You get an output similar to this:
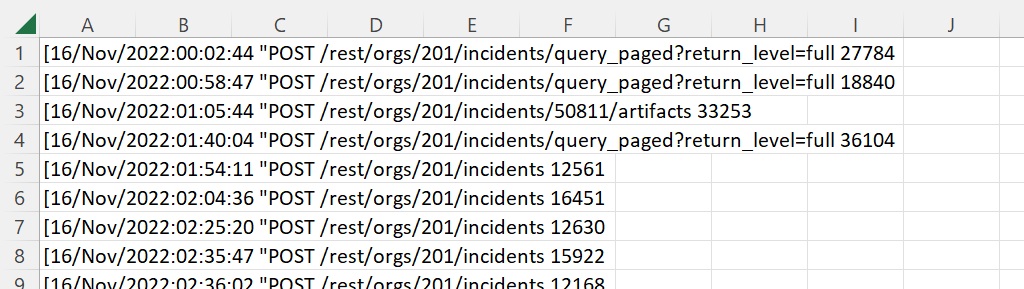
[01/Nov/2019:06:59:41 "DELETE /rest/orgs/202/tasks/2635711/comments/606680 785688 [01/Nov/2019:07:17:44 "POST /rest/orgs/202/incidents/21351/comments 619538 [01/Nov/2019:07:17:45 "POST /rest/orgs/202/tasks/2635715/comments 892513 [01/Nov/2019:07:24:04 "POST /rest/orgs/202/tasks/2641447/comments 865002 [01/Nov/2019:07:24:04 "POST /rest/orgs/202/tasks/2641447/comments 1010573 [01/Nov/2019:07:24:04 "DELETE /rest/orgs/202/tasks/2635715/comments/606684 1193194 [01/Nov/2019:07:24:05 "POST /rest/orgs/202/tasks/2635715/comments 855091 [01/Nov/2019:07:32:15 "POST /rest/orgs/202/incidents/21283/comments 682925 [01/Nov/2019:07:37:39 "POST /rest/orgs/202/incidents/21336/comments 889069 [01/Nov/2019:07:50:17 "POST /rest/orgs/202/incidents/21336/comments 1636499 [01/Nov/2019:07:55:49 "POST /rest/orgs/202/tasks/2641086/comments 1676496 [01/Nov/2019:07:55:49 "POST /rest/orgs/202/tasks/2641086/comments 1500889 - The space-separated columns are: Date and timestamp | HTTP method | URL | Response time in milliseconds
- Now your client_access.log file data is ready to be inserted into excel in order to be converted into performance graphs.
*IMPORTANT*
This process above for getting an output from the log through the given command is only to apply on the data from the client_access.log file as the actual data directly copied and pasted from the file as it might result hard to accommodate into an excel sheet, differently from "resilient-scripting-monitoring.log" and "monitoring.log" which composition is already friendly at the time of pasting into excel. In summary this part would only apply if you are looking to get the slow response times in SOAR.
SECTION II.
STEP 1. Importing data into the excel sheet.
-If you are looking to get slowest response times, copy the entire output obtained as explained in Section I and paste it into an excel sheet like this:
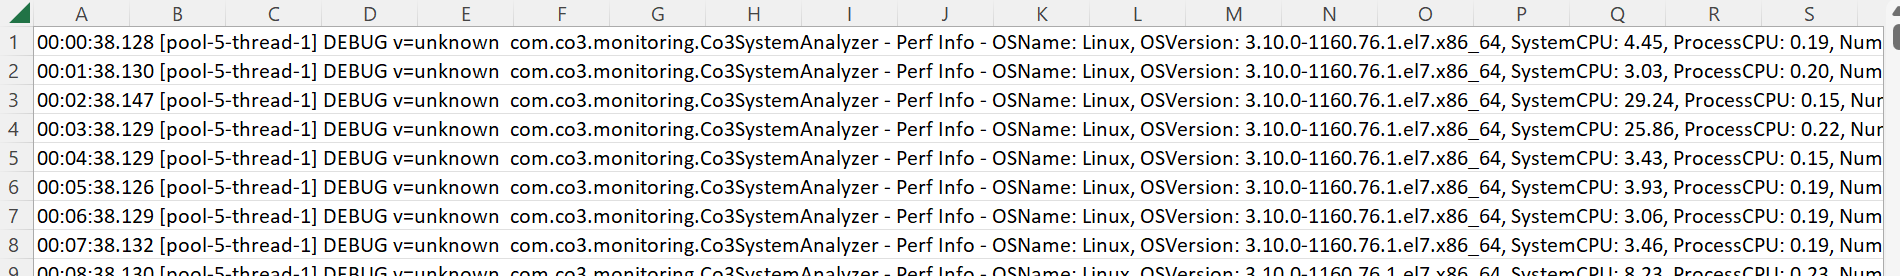
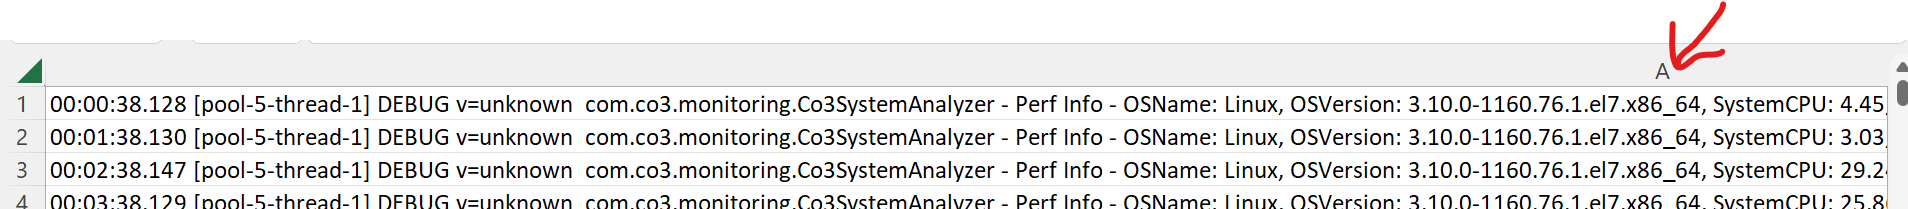
-If you are looking to get resource utilization do a cat to one of the monitoring files given above(preferably resilient-scripting-monitoring.log), copy the output and paste it to the excel sheet like this:
-sudo cat /usr/share/co3/logs/monitoring.log

-sudo cat /var/log/resilient-scripting/resilient-scripting-monitoring.log
STEP 2. Setting delimiters in excel for the imported data.
-Since data is not delimited in separate cells after imported it is necessary to delimit this manually so we can separate in cells the data from their corresponding time stamps allowing us the creation of the graphs in a timeline base.
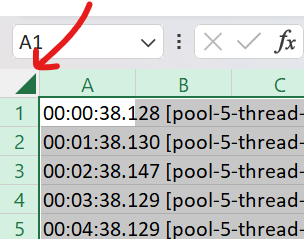
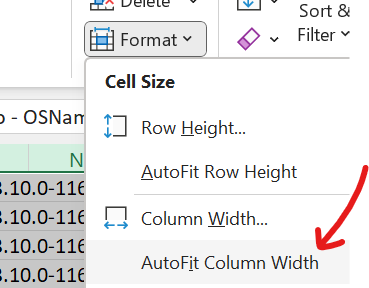
*First change the column width to "Auto Fit":
B. On "Home Tab" >> Drop down "Format" >> Click "AutoFit Column Width"
C. Now you should have just one entire column for all the data like this:
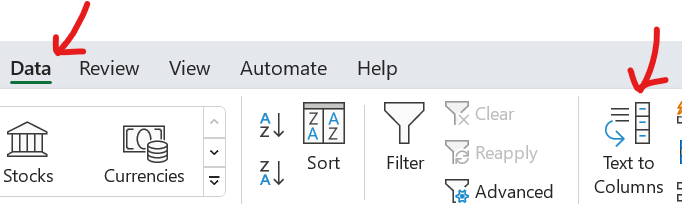
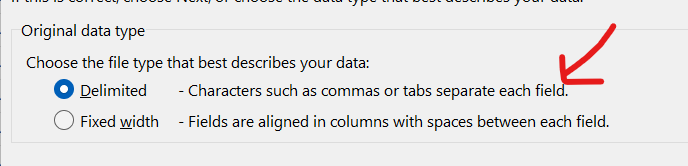
D. Now, make sure have the "A" column selected. On "Data Tab" >> Go to "Text to Columns" >> Check "Delimited" >> Next >> Check "Space" Box and remove Check on "Tab" box >> Next >> Make sure the timestamp column is in Black(Selected) and check the "Date" Circle so excel can interpret is in time format:
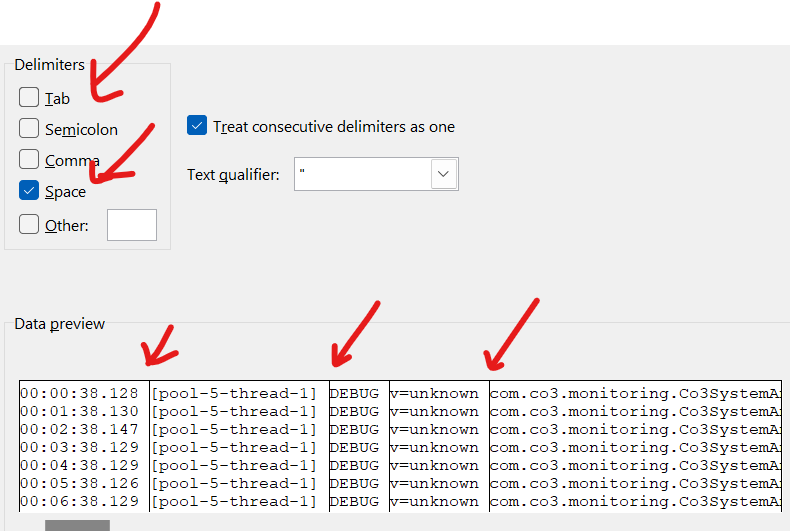
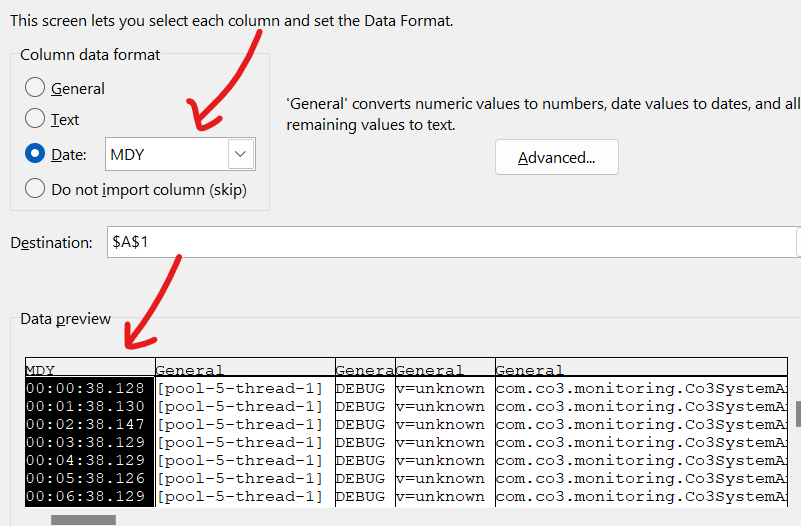
"IMPORTANT: For resource utilization, graph also check the "comma" delimiter so the comma does not interfere in the resource percentage value later on when creating the graphs.""
E. Repeat point "A" to autofit columns again. You should have now something like this:
If from resilient-scripting-monitoring.log:

Note: If the format of the time is confusing as it shows above simply Select the time column >> Home Tab>>Format>> Drop Down>> Format Cells>> Category: Time>>Select Type and time format you want> Hit OK
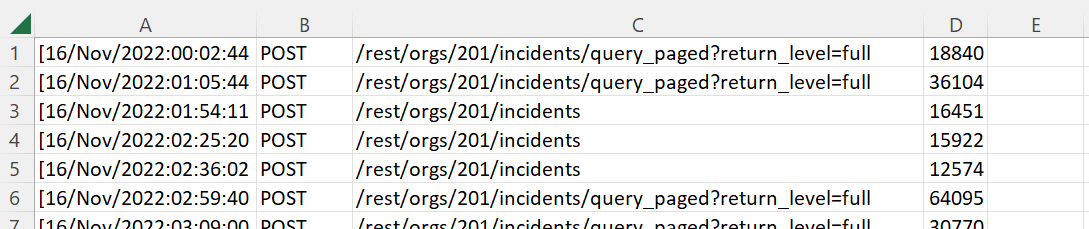
If from client_access_log<YYYY-MM-DD>.log
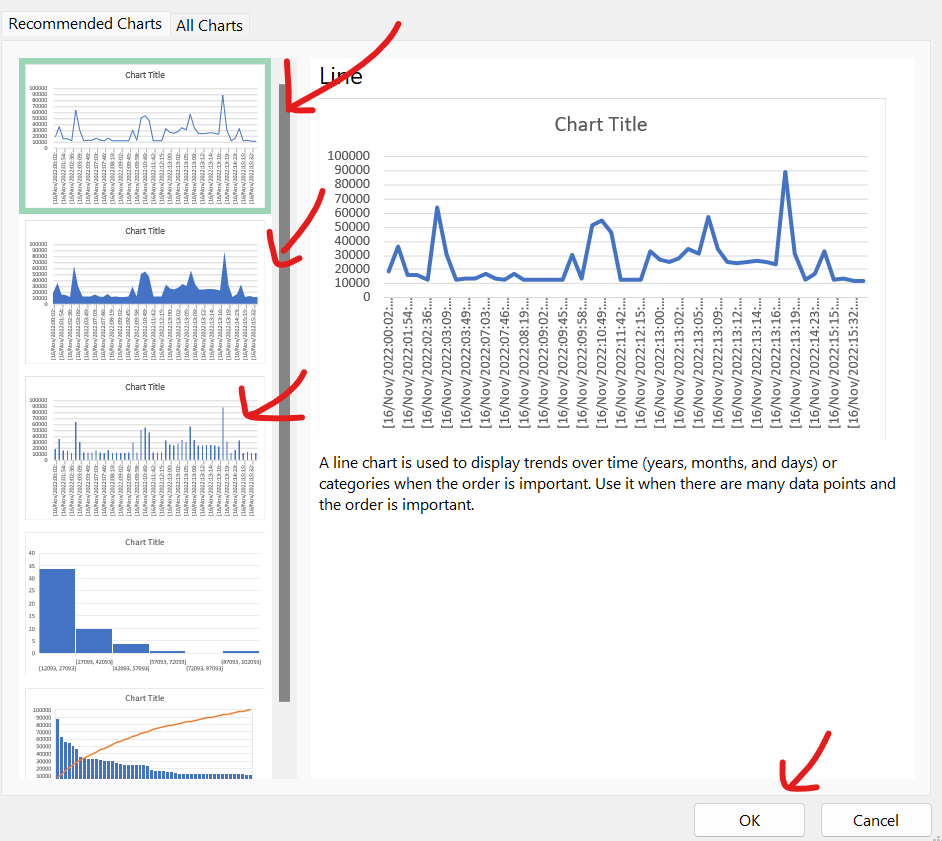
STEP 3. Converting sorted data into graphs.
A.Since it is a time-based graph first you must select the timestamp column and then the column that contains that value that you want to graph against the timestamps for example:
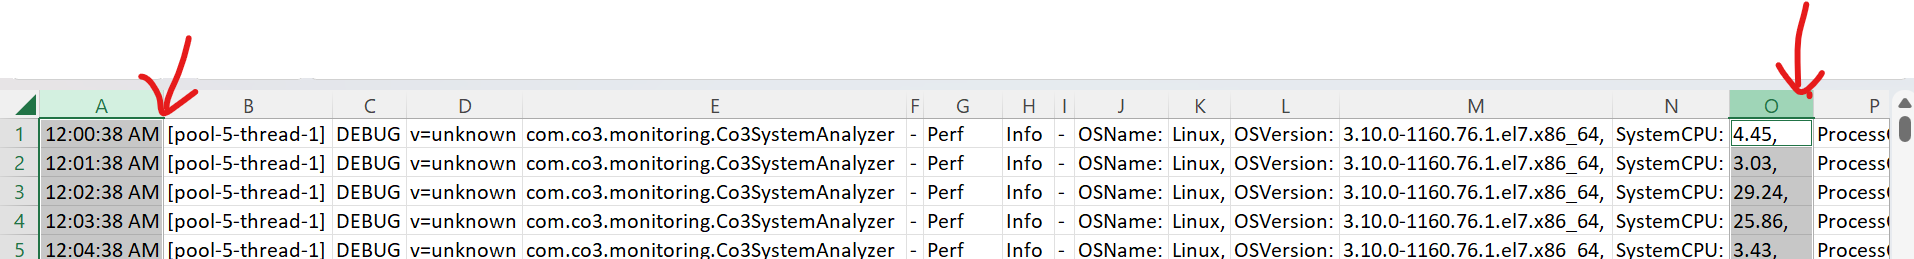
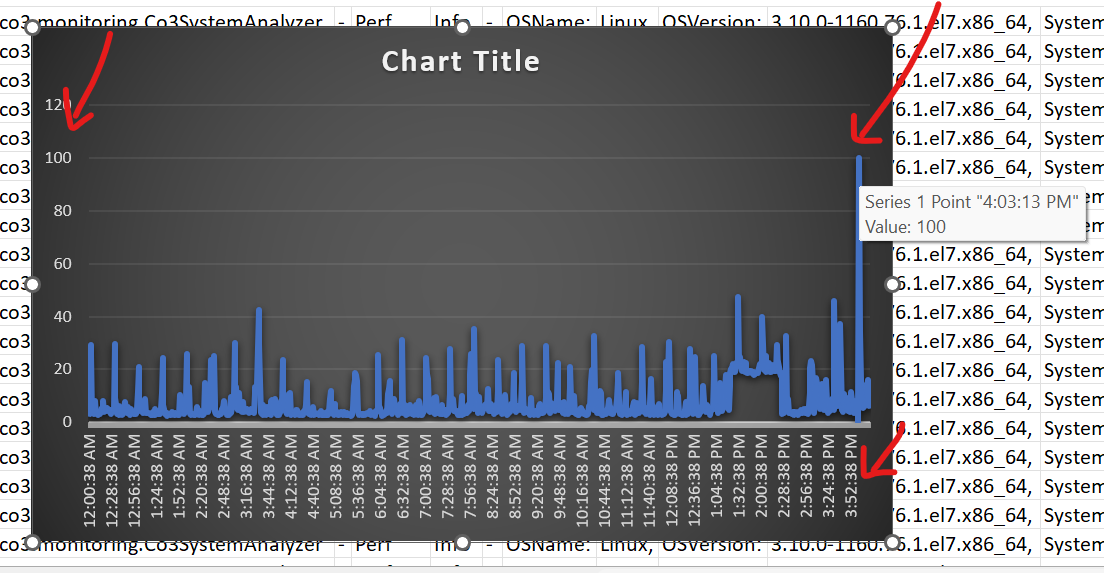
For resource usage we want to look for columns A(timestamp) and O(For System CPU percentage), so we can have visibility of CPU percentages and their timestamps. You can also use the memory usage-related values or any other. So in order to select these two columns, click the "A" column then hold "Ctrl" key and click the "O" column, and now both columns are selected.
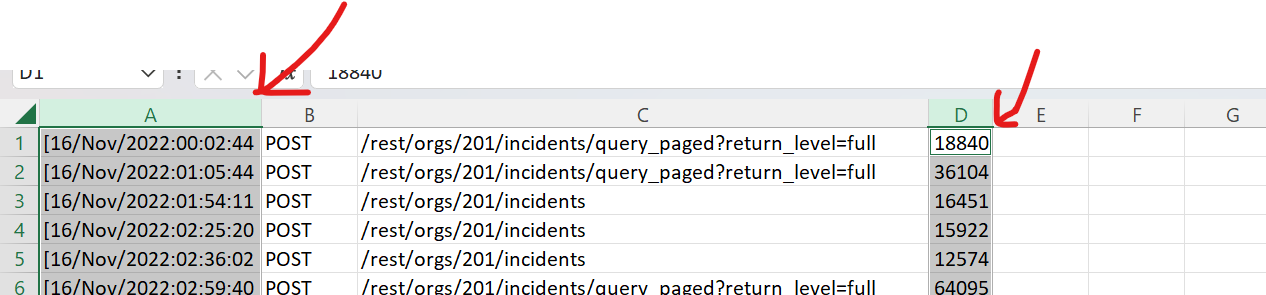
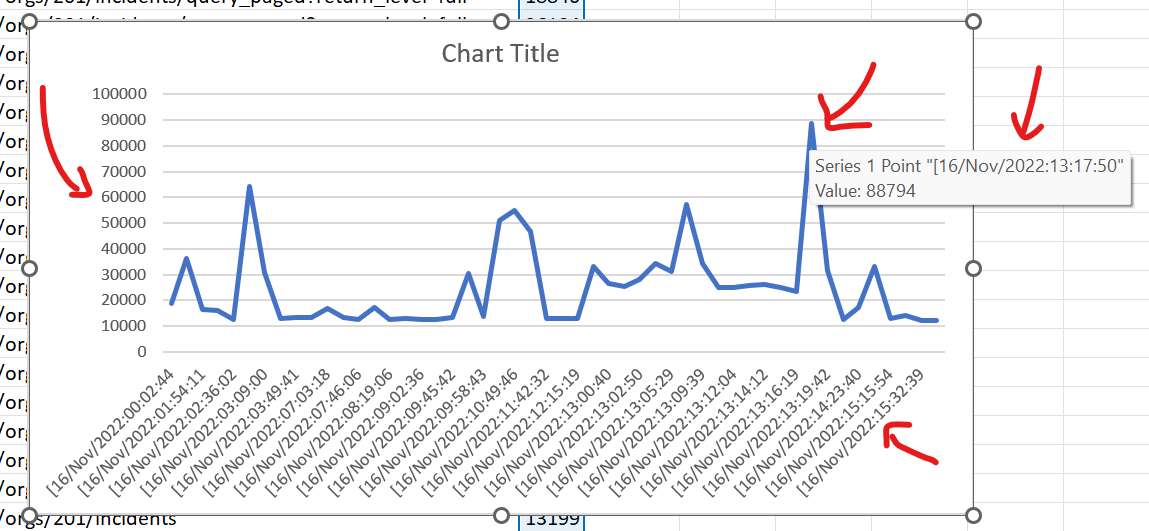
For slowest response times, want to select the timestamp column and response time column:
Slowest response times:
CPU Usage Utilizations:
Document Location
Worldwide
Was this topic helpful?
Document Information
Modified date:
29 March 2023
UID
ibm16848211