How To
Summary
mod_log4j.pl is a menu-driven CLI script that assists users in properly enabling and disabling debug loggers in /opt/qradar/conf/log4j.xml
Steps
Before you start
Identify the class path you want to debug. Class paths generally start with com.q1labs. The shorter the path, the broader the resulting logging is. The class names can be found in qradar.log. If you have multiple appliances, use the IP address in the log to identify the appliance it came from.
In the following log example, the class path is com.q1labs.reporting.ReportServices, but to capture more information, you could use com.q1labs.reporting:
[report_runner] [main] com.q1labs.reporting.ReportServices: [INFO] [NOT:0000006000][X.X.X.X/- -] [-/- -]Accumulated
data is not available for admin#$#59f82228-f1d8-4693-910f-2c13d5cd6b3c, chart 'Authentication Failed by UserName'.
Falling back to raw data.
Steps
Debug logging can be verbose, so be as specific as possible when you are choosing a path. Set short debug timers or manually reset the debugging settings when you are finished.
- SSH into your QRadar console.
- (Optional) SSH into the appliance the error or log came from.
- Run the mod_log4j.pl tool. When run, it automatically discovers JMX application names for use when you enable debugging.
/opt/qradar/support/mod_log4j.pl - Enter a name to track your debugging changes by, then observe the main menu.
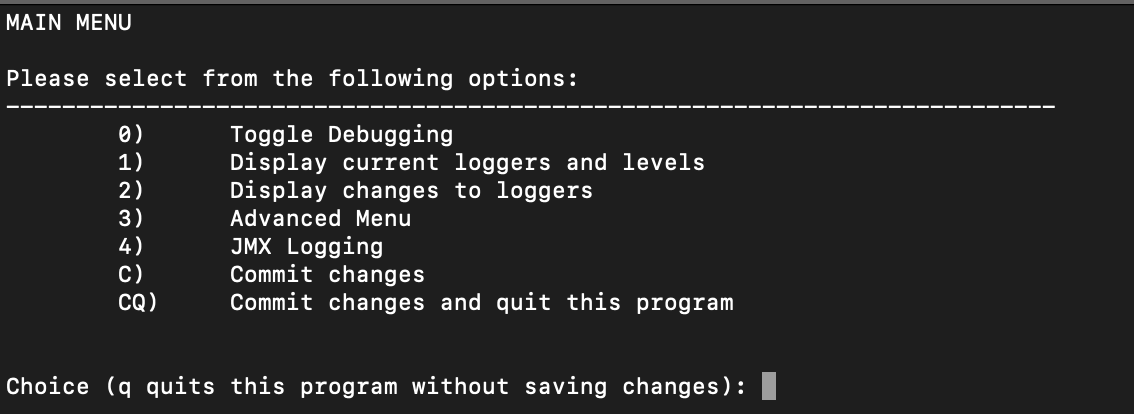
- Toggle debugging by entering 0.
- The logger lists the classes it discovered. If none of them are the class path you need, enter A to add a logger manually.
Note: If you enable an existing logger, the default timer is 1 hour. - If you are adding a logger manually, enter the class path.
- If you are adding a logger manually, enter a debug duration such as 1 hour.
- The debug menu displays the current logging status of the discovered classes between DEBUG, ERROR, WARN, INFO, or OFF.
Toggle more debuggers or enter q to return to the main menu.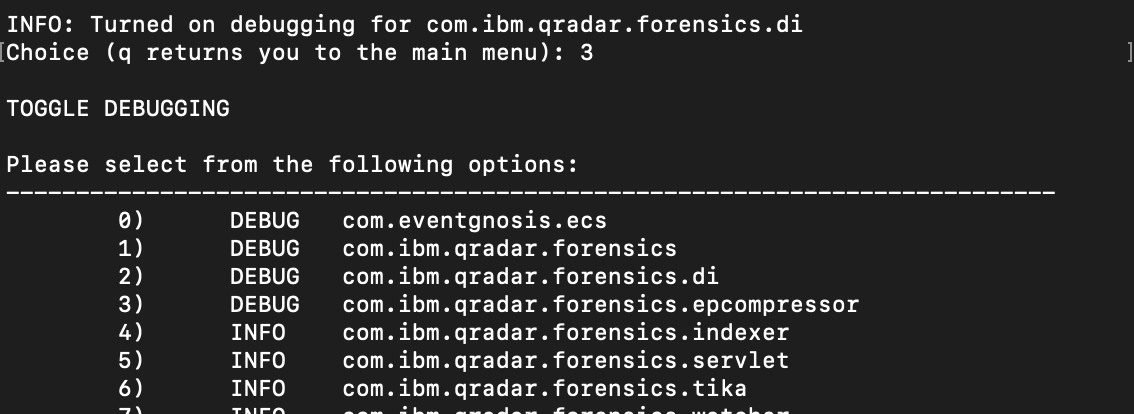
- Enter CQ to commit changes and quit the tool.
Result
The logs are saved to /var/log/qradar.java.debug. You can use the -r flag to return the debugging setting to the defaults./opt/qradar/support/mod_log4j.pl -r -who <USER>
mod_log4j.pl menu functions
0) Toggle Debugging
- Create new loggers for specific classes or set the logging level of existing loggers to DEBUG.
1) Display current loggers and levels
- Displays the logging level of existing loggers.
2) Display changes to loggers
- Compares the current loggers and levels to the defaults. This check includes uncommitted changes.
3) Advanced Menu
- Includes the options to:
- Modify a logger: Set a logger to DEBUG, ERROR, WARN, INFO, or OFF.
- Add a logger.
- Delete a logger.
- Restore defaults: Reset the logging settings to the default and commit those changes. This resets uncommitted changes.
4) JMX Logging
- Various JMX options.
C) Commit changes
- Save changes.
CQ) Commit changes and quit this program
- Save changes and quit.
Document Location
Worldwide
[{"Type":"MASTER","Line of Business":{"code":"LOB24","label":"Security Software"},"Business Unit":{"code":"BU059","label":"IBM Software w\/o TPS"},"Product":{"code":"SSBQAC","label":"IBM Security QRadar SIEM"},"ARM Category":[{"code":"a8m0z000000cwsyAAA","label":"Admin Tasks"}],"ARM Case Number":"","Platform":[{"code":"PF025","label":"Platform Independent"}],"Version":"All Versions"}]
Was this topic helpful?
Document Information
Modified date:
19 October 2022
UID
ibm16828341