News
Abstract
The following updates are available in release 2.0.81 SC of Planning Analytics.
Content
The following feature notices apply to Planning Analytics Workspace.
Single cell widget is now a visualization type
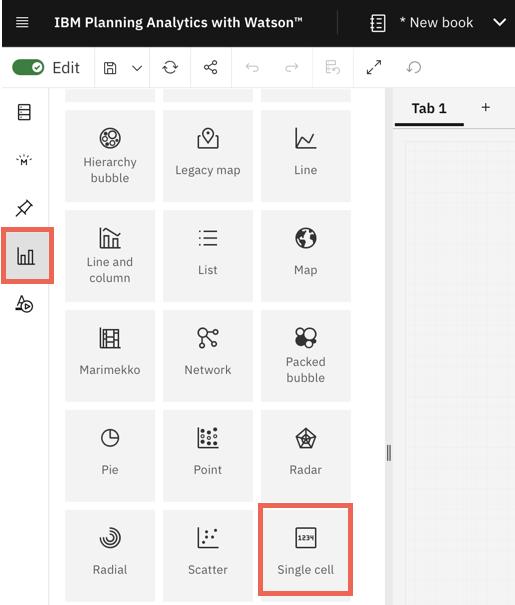
Note: Unless you select a specific cell in the view, when you add a single cell visualization with this method, the visualization displays data from the first cell in the view.
When you select the single cell visualization and go to the Fields tab, you can see dimensions and filters in their appropriate fields. You can also change the color palette for any conditional rules applied to the visualization and enable automatic refresh under the Visualization tab under Properties. Previously, fields and visualization properties were not available for the single cell widget.
Note: Any existing cell widgets in books from before Planning Analytics Workspace 2.0.81, will convert to the new single cell visualization with Field dimensions and visualization properties.
You can convert single cell to another visualization or an exploration and vice versa. When you convert another visualization or view to a single cell visualization, single cell displays data from the first cell.
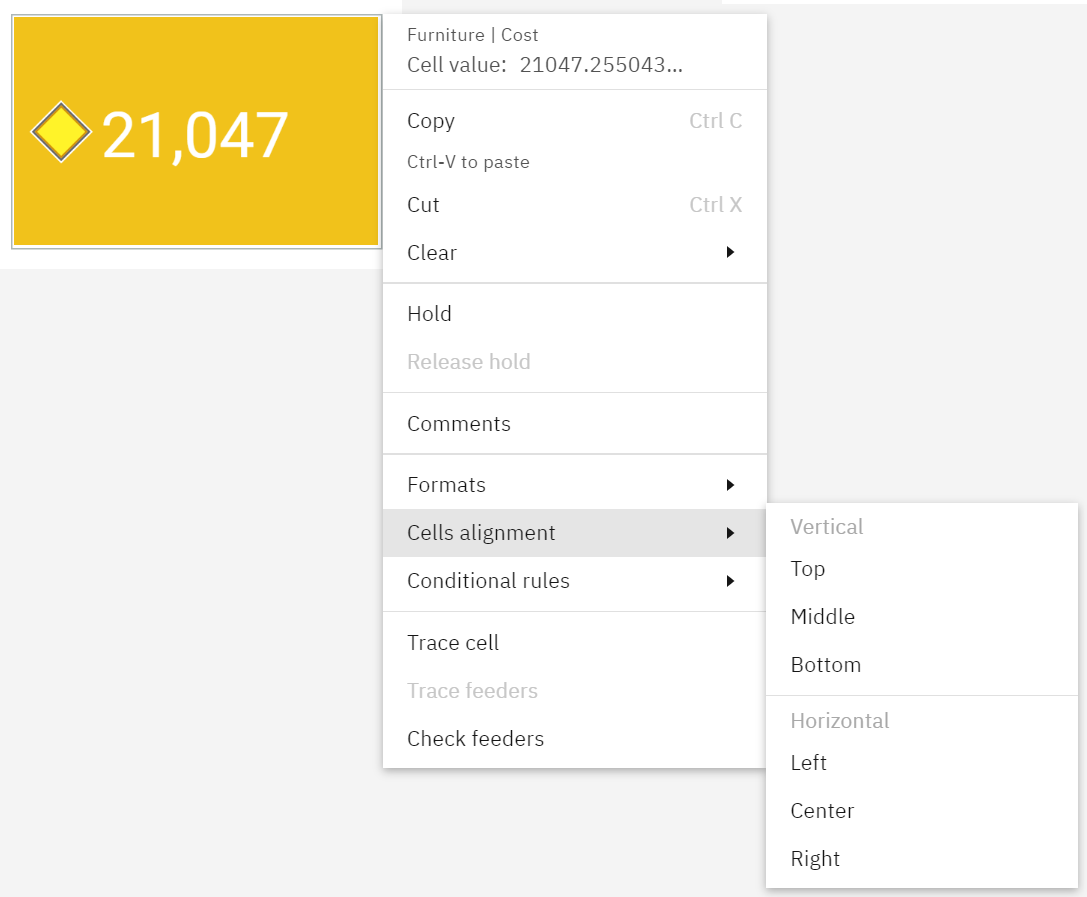
The new cell alignment option is also available for single cell visualizations. Right-click a single cell visualization to see cell alignment and other formatting options for the visualization.
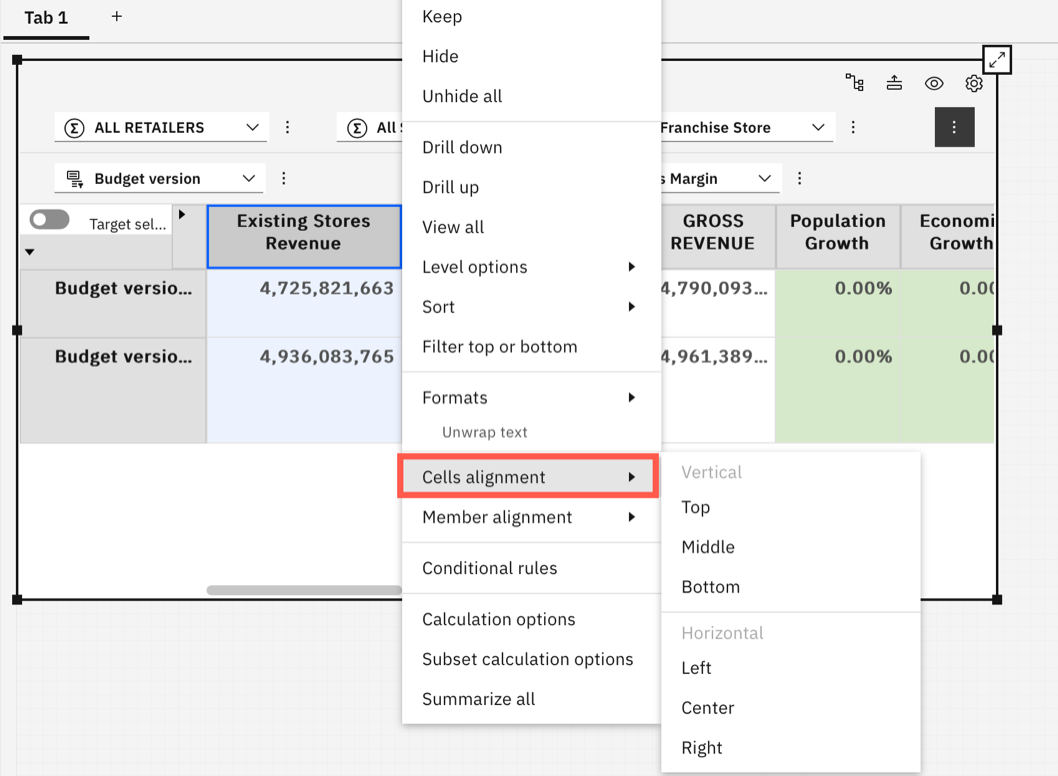
Align data cells and headers
In explorations, you can align text in data cells and headers either vertically or horizontally. You can align a row or column of data cells, align a member in row and column headers, and align based on hierarchy.
Right-click a data cell and select Cells alignment to see text alignment options.
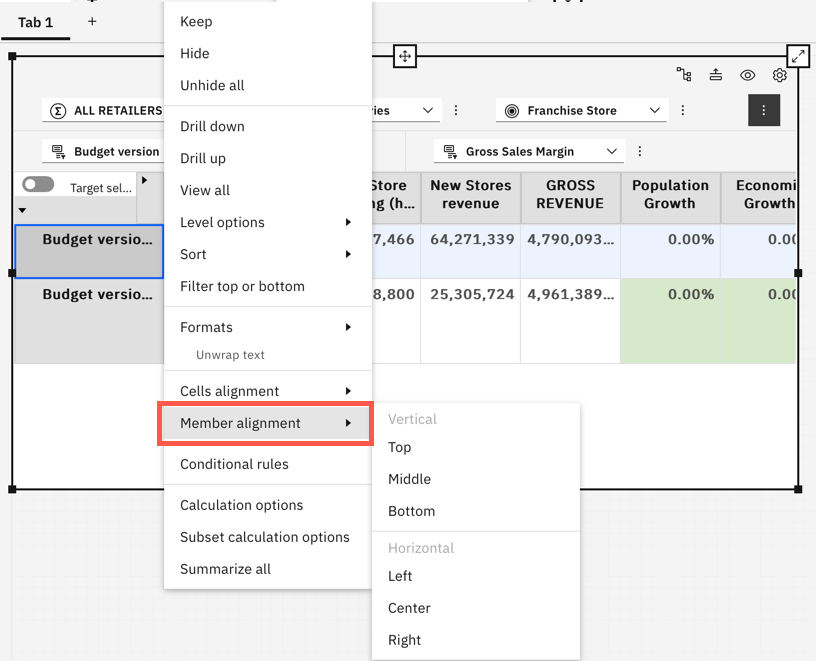
To align members in row or column headers, right-click a row or column header and under Member alignment, select an alignment option.
You can also align text in the new single cell visualization vertically or horizontally. Simply, right-click the visualization to see alignment options.
You can clear text alignment in an exploration or single cell visualization by right clicking the cell and selecting the alignment option under Clear.
Include plans and applications when you copy and deploy assets with Lifecycle Management
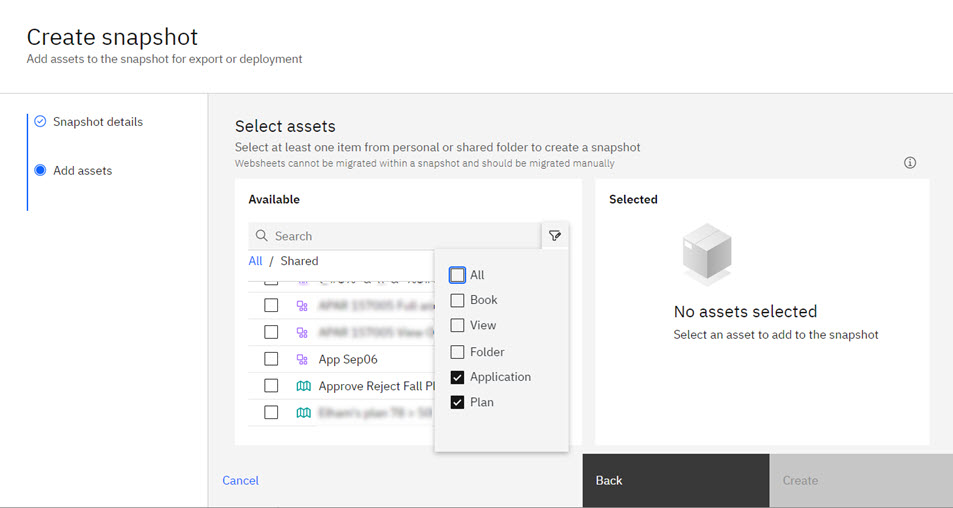
When you add a plan or application to a snapshot, all books and views within the plan or application are also included in the snapshot. However, as Lifecycle Management does not support websheet migration, any websheets present in a plan or application are not included in the snapshot.
If a step in a plan includes a contributor or approver group that is not available on the target database, the group is removed from the step when the snapshot is deployed. You must manually update the step to use a valid group on the target database.
Use rich text formatting in plan and application descriptions
You can now apply rich text formatting to enhance your plan and application descriptions.
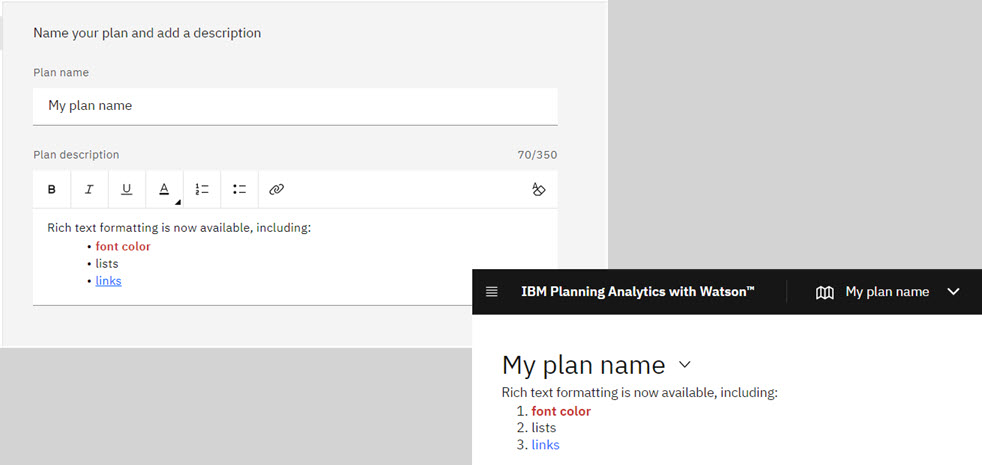
The new text formatting toolbar on the plan or application description box lets you quickly apply text formatting, create numbered and bulleted lists, and create links.
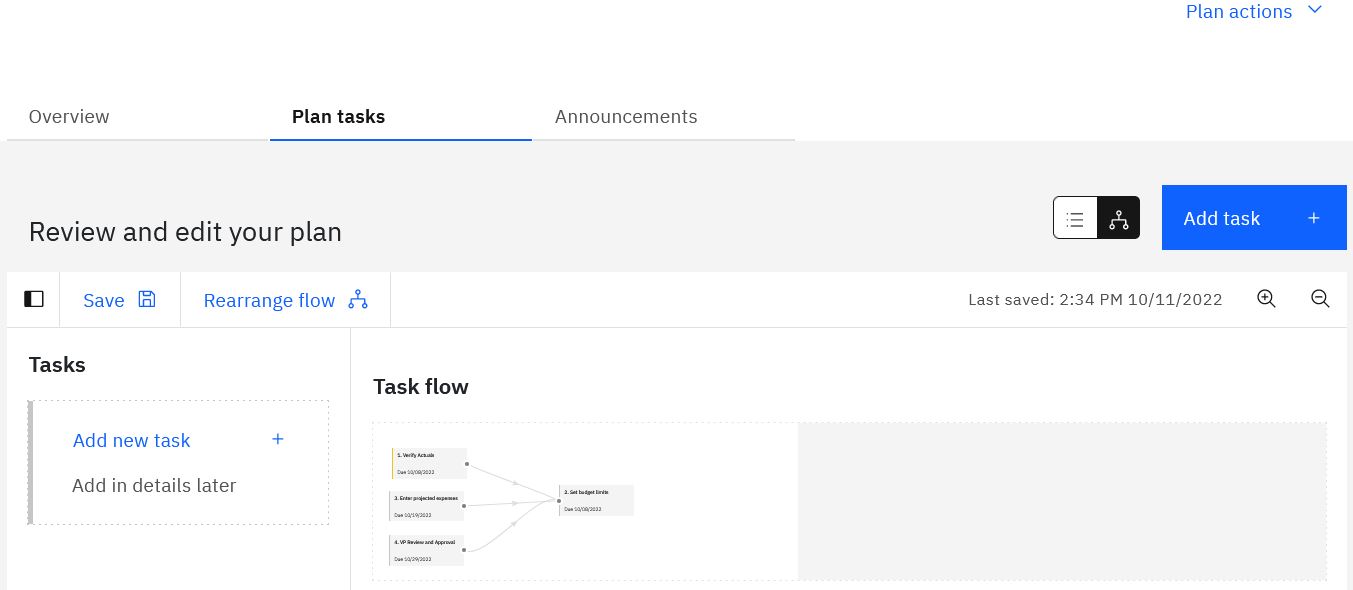
Task flow user interface in plans
Drag tasks that depend on each other onto the Task flow canvas to create a visual representation of the task dependencies.
Updated 'Import members' procedure
As part of our continued investment in the IBM Carbon Design methodology and in the interest of providing a consistent user experience across all components, the Import members procedure for a dimension has been updated to use Carbon Design principles.
The new procedure uses more intuitive controls to define a data source and set mappings.
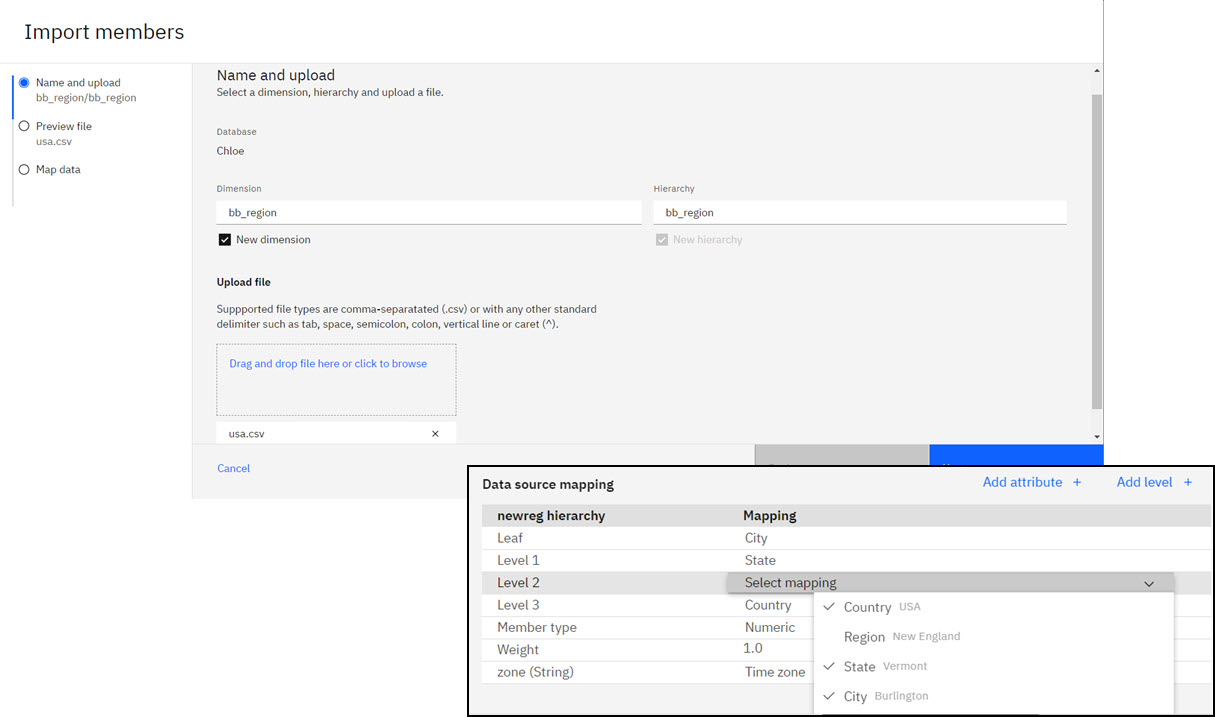
Additionally, you can import members into a dimension from multiple locations on the Databases tree. Depending on the launch point, your ability to create or modify metadata might be limited.
- update an existing dimension and an existing hierarchy
- update an existing dimension and create a new hierarchy
- create a new dimension and a new hierarchy
If you click <dimension name>, Import members on the Databases tree, updates apply to the dimension you clicked, but you can pick the hierarchy to update or choose to create a new hierarchy.
If you click <hierarchy name>, Import members on the Databases tree, updates apply only to the hierarchy you clicked.
Snippets in the process editor
The process editor in Planning Analytics Workspace provides predefined code snippets that users can insert in the TurboIntegrator process.
The TurboIntegrator process code can be repetitive. Users often repeat the same tasks, changing only the variable or object names. The code snippets simplify the repetitive tasks, making the process less error-prone.
To use the snippets, on the Script tab in the process editor, click the snippet icon in the toolbar, as highlighted in the following image:
![]()
The following categories of snippets are available: Iterators, Create, and Other. Expand the category to view the list of snippets, and select one of them.
Here's an example of one of the available iterator snippets:
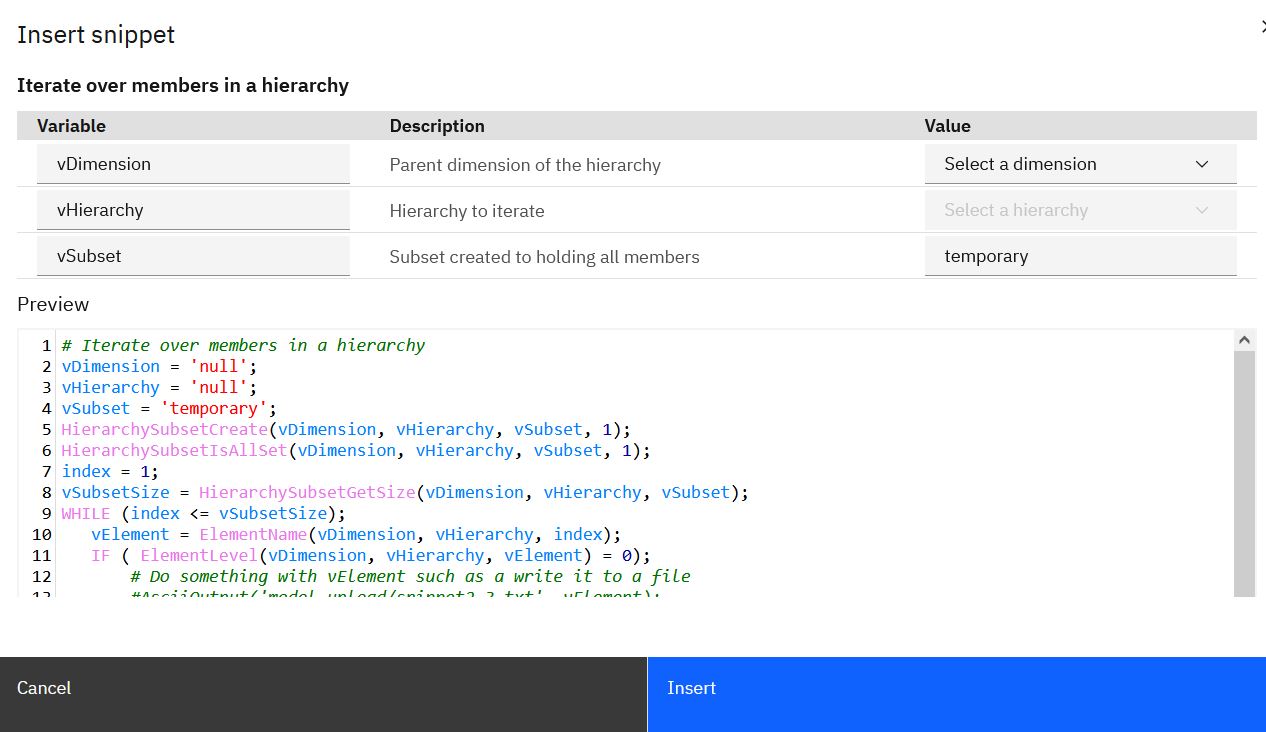
The Variable and Value columns are editable. The vDimension is the list of dimensions in the database. vHierarchy is the list of hierarchies within the selected dimension. vSubset is a text entry.
As you specify values, the Preview is updated with your input. When you click Insert, the snippet is dropped in the line under the current position of the cursor.
Deprecation notice - the set editor in a widget is no longer available from books as of Planning Analytics Workspace 2.0.81
The ability to add a set editor in a widget from the Data tree in books is removed from Planning Analytics Workspace 2.0.81.
Now, when you edit a set from the Data tree, the new experience set editor opens. The new set editor opens as a dialog and is not inserted as a widget in the book.
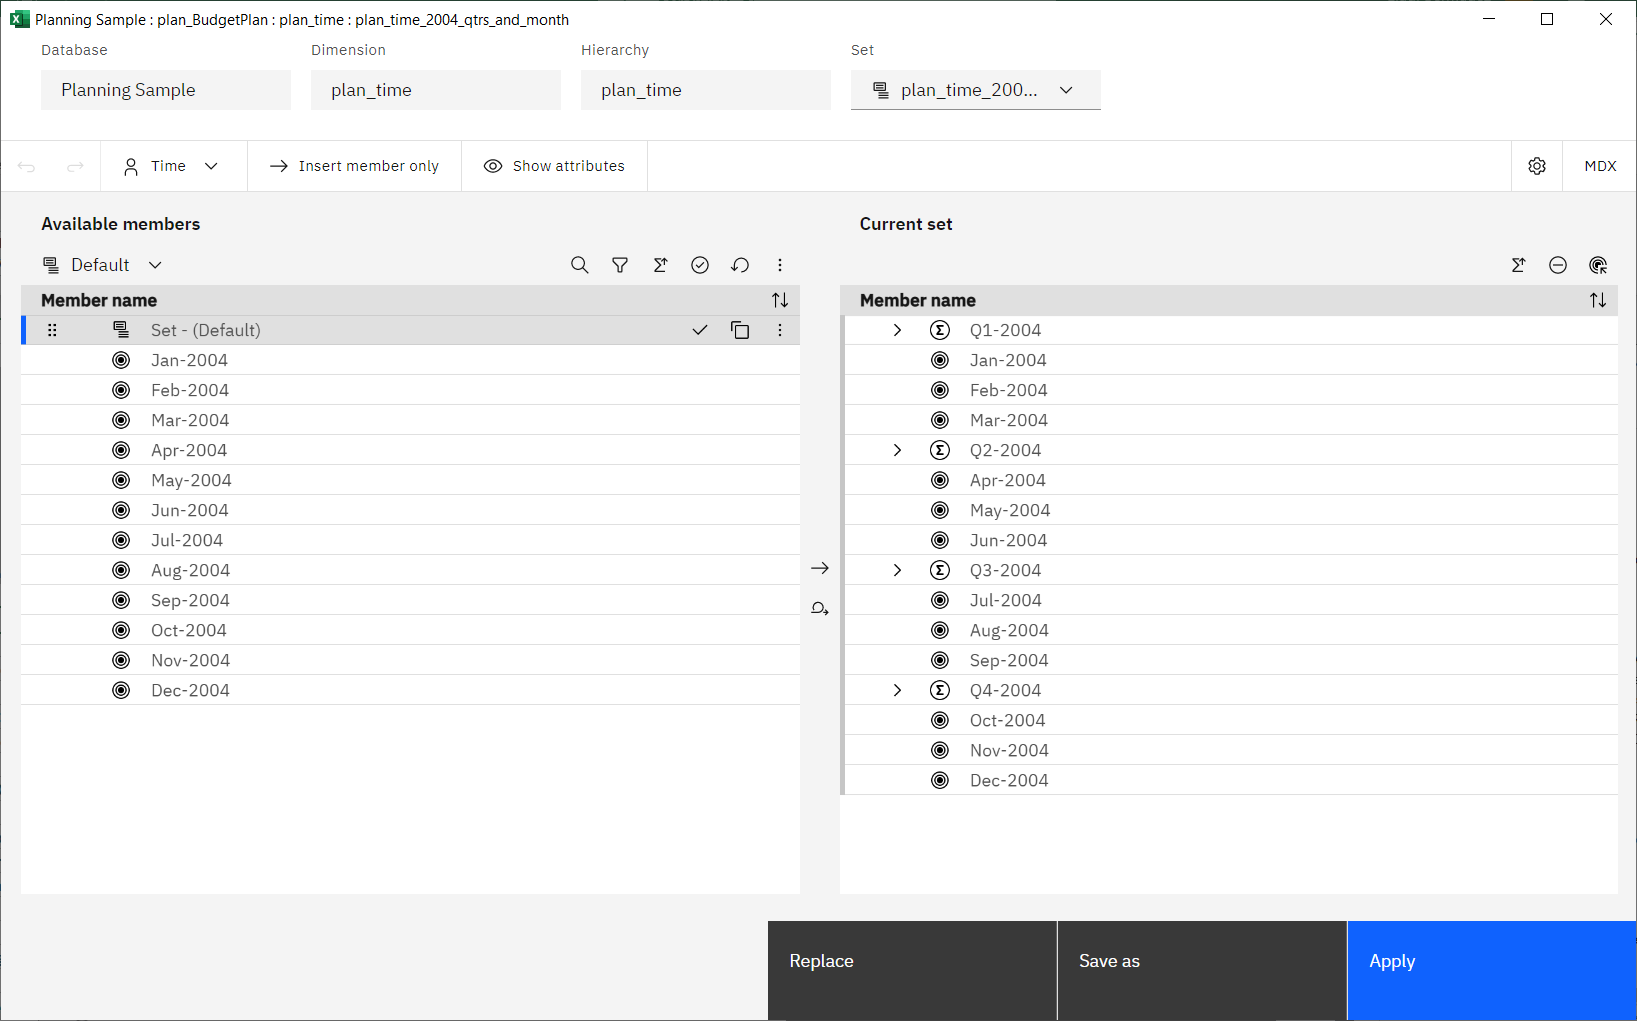
Note: You can still add the set editor to a modeling workbench. When you open or create a set from the Databases tree in a workbench, the set editor appears on a new tab on the active tabset.
The new experience set editor was introduced in Planning Analytics Workspace 2.0.71. For more information, see New experience view and set editor.
Was this topic helpful?
Document Information
Modified date:
18 October 2022
UID
ibm16825983