How To
Summary
It might happen, that a query runs slower in IBM Db2 Analytics Accelerator for z/OS than expected. This document explains how to identify slow running queries and how to collect diagnostic information for IBM Support to investigate the performance issue and tune the query.
Objective
The document explains how to use the following features to identify slow running queries and to collect diagnostic information about the queries in IBM Db2 Analytics Accelerator for z/OS:
- Accelerator Studio Query Monitoring
- Accelerator Studio Current Tasks
- Stored procedures ACCEL_GET_QUERIES2 and ACCEL_CONTROL_ACCELERATOR
- Accelerator Studio controls to collect performance diagnostic information per query or from the overall accelerator system
Environment
Db2 Analytics Accelerator V7.5.9 or later is required to use all of the described features.
Steps
Identifying Problem Queries
The Accelerator Studio Query Monitoring section lists currently running and finished SQL statements (for example queries) on the accelerator. For each SQL statement some execution metrics are displayed such as elapsed time, fetch time, wait time, or result size. The information displayed in this section corresponds to the output of stored procedure ACCEL_GET_QUERIES2.
With Accelerator maintenance level V7.5.8, the 'Application Handle' and 'Prepare Time' values were added to the list of execution metrics per SQL statement. The 'Prepare Time' is the elapsed time of the PREPARE operation in Db2 Warehouse on the accelerator, which takes place at the beginning of the statement execution and before the statement can return any result. Typically the 'Prepare Time' is short. If it is long, that is, in the range of minutes, it is recommended to cancel the query and collect documentation for IBM Support.
With Accelerator maintenance level V7.5.8, a prepare time DSNX881I message can be configured to detect when the prepare time is too long. The 'Application Handle' value can be used to map a slow running query to the Monitor->Current Tasks display in Accelerator Studio.
In the following example, the Monitor->Current Tasks display shows an SQL statement with application handle 32992 that is consuming lots of resources. This display lists only currently running SQL statements.

The Accelerator Studio Query Monitoring section lists a query with 'Application Handle' value 32992 in Fetching state. This is the query that is consuming lots of resources.

Note, that there are previous executions of a query on the accelerator that use the same application handle. The accelerator reuses application handles when executing queries. When you locate a currently running SQL statement in the Monitor->Current Tasks display, then the corresponding statement in the Query Monitoring section is always a currently running one, and not a completed one having got the same application handle.
Collecting diagnostic information for slow running queries
When a slow running query is identified, collect the following diagnostic information and provide it to IBM Support within a support case:
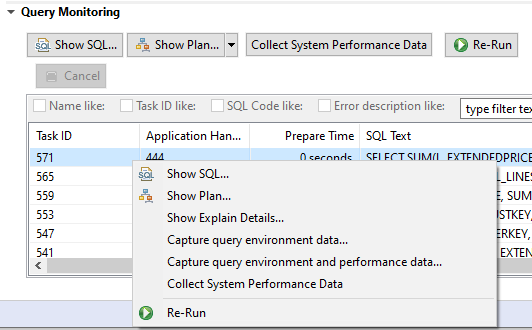
In the Accelerator Studio Query Monitoring section, right-click the query and select Capture query environment data (CQED) or Capture query environment and performance data (CQEPD) operation. However, the operation Capture query environment and performance data is preferred, as it executes the SQL again with extra tracing enabled in Db2 Warehouse. If the slow running query consumes significant resources, this operation could negatively affect any concurrent operation on the accelerator. In this case it is recommended to either run CQEPD during 'off peak'-hours or run CQED.
After the selected operation completed for the slow running query, open the Save trace dialog in Accelerator Studio and click the Manually collected diagnostic information (folder additional_support_info) checkbox. Additionally click the Accelerator trace information checkbox. Then, save the trace and attach the saved .zip file to a support case.
Collecting diagnostic information for overall slow performance
Sometimes the overall performance of SQL statements on the accelerator is slow and it is difficult to pinpoint specific SQLs as the cause for an overall slowdown. With Accelerator maintenance level V7.5.9 the Collect System Performance Data feature was introduced. It captures performance-related information of the current state of the accelerator. You can collect system performance data either by clicking the operation in the Accelerator Studio Query Monitoring section or by calling the ACCEL_CONTROL_ACCELERATOR stored procedure. Collect system performance data while overall system performance is bad, even at regular intervals when applicable.

The following shows a sample input XML string for ACCEL_CONTROL_ACCELERATOR:
<aqt:controlCommand xmlns:aqt="[http://www.ibm.com/xmlns/prod/dwa/2011 http://www.ibm.com/xmlns/prod/dwa/2011]"
 version="1.0">
    <getAdditionalSupport traceCommand="SYSTEM_PERFORMANCE_DATA"
     timeoutInMinutes="0" topQueries="10"/>
</aqt:controlCommand >
Use the default options unless otherwise specified by IBM Support. When system performance data collection finished, open the Save Trace dialog and click the Manually collected diagnostic information (folder additional_support_info) checkbox. Then save the trace and attach the saved .zip file to a support case.
Document Location
Worldwide
[{"Type":"MASTER","Line of Business":{"code":"LOB10","label":"Data and AI"},"Business Unit":{"code":"BU059","label":"IBM Software w\/o TPS"},"Product":{"code":"SS4LQ8","label":"Db2 Analytics Accelerator for z\/OS"},"ARM Category":[{"code":"a8m0z0000000741AAA","label":"Administration"},{"code":"a8m0z0000000775AAA","label":"Db2 related products and functions-\u003EDb2 Analytics Accelerator for z\/OS"},{"code":"a8m0z000000078yAAA","label":"Troubleshooting-\u003EPoor performance"}],"ARM Case Number":"","Platform":[{"code":"PF035","label":"z\/OS"}],"Version":"7.5.0"}]
Was this topic helpful?
Document Information
Modified date:
30 September 2022
UID
ibm16621333