How To
Summary
This article describes how to determine whether your QRadar appliance is sized correctly for the amount of EPS (Events per Second) rates your device is exposed to. Be aware, apart from EPS rates there are other factors, which can impact your device's performance, such as the number, logic, and complexity of your rules, CEPs (Custom Event Properties), Ariel searches and more. Due to QRadar flexibility and customizability, it is not possible to provide strict requirements for every usage scenario.
Steps
Using the QRadar User Interface.
1. Log into the QRadar User Interface
2. Select the Dashboard tab.
3. Go to Event Rate (EPS) (Count) graph and expand the settings by clicking the Settings button (yellow cogwheel).
4. Make sure the Time Range is set to at least 7 days, which minimizes the margin of error.
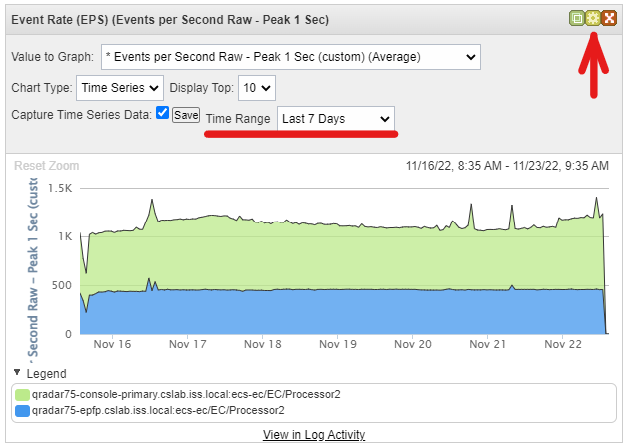
In the presented example, the EPS rates did not exceed 1500 on the console and remained close to 500 on the Event and Flow processor throughout the week.
Using the CLI (command-line interface).
1. Use SSH to access one of the devices in your environment, by running the following command. Make sure to substitute "user" with your correct user name and "192.168.1.8" with your device's IP address.
ssh user@192.168.1.8
2. Filter the logs and find all lines containing phrases 'ecs-ec-ingress' and 'Incoming raw event rate'.
grep -E 'ecs-ec-ingress.*Incoming raw event rate' /var/log/qradar.log
The output contains EPS rates information, minute by minute. In this example, we extracted just a single line for demonstration purposes.
[ecs-ec-ingress.ecs-ec-ingress] [SourceMonitor-1/ecs-ec-ingress.ecs-ec-ingress] com.q1labs.sem.monitors.SourceMonitor: [INFO] [NOT:0000006000][/- -] [-/- -]Incoming raw event rate (5s: 197.80 eps), (10s: 201.50 eps), (15s: 200.67 eps), (30s: 202.73 eps), (60s: 206.60 eps), (300s: 207.91 eps), (900s: 207.91 eps). Peak in the last 60s: 219.80 eps. Max Seen 3179.42 eps. EC Throttles/5s (60s: 0.17). Total EC Throttles in the last 60s: 2. Total EC Throttles: 75816. Appliance Threshold: 502.00
Incoming raw event rate provides average EPS rates per several time ranges: 5, 10, 15, 30, 60, 300, 900 seconds. It also shows the highest value within the last 60 seconds, as well as Max Seen, which is the highest noted figure.
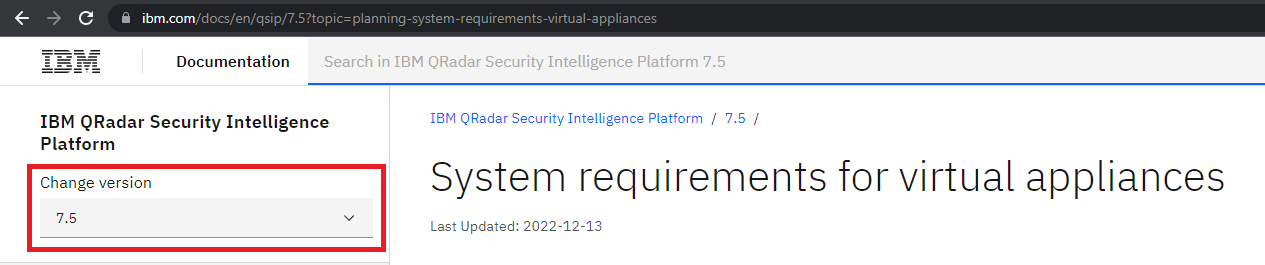
3. 4.After you determine the actual EPS rates on your device, you can verify whether your hardware resources are sufficient for processing all the incoming events. Visit System requirements for virtual appliances and select the correct QRadar version.
Find your device type on the lists in sections Memory requirements, Processor requirements and locate the correct Threshold for your EPS rates.
4. The last step is to examine your device and verify the amount of memory and number of CPU cores it is equipped with.
Use SSH to access the device and run the following command.
free -h
The output looks similar to the one presented.
              total        used        free      shared  buff/cache   available
Mem:            62G        8.3G         18G        6.0G         36G         48G
Swap:           23G          0B         23G
The total memory size is 62G, which is very close to Suggested memory requirement that is 64 GB. On the Event and Flow processor the EPS rates stayed close to 500, while the maximum value for this memory configuration is 5000 or less.
5. Run the following command to get the number of CPU cores installed on your device.
lscpu | grep '^CPU(s):'
The output looks similar to the one presented.
CPU(s): 32
In this example 32, is also the suggested number of CPU cores for 5000 EPS or less, which means the exemplary Event and Flow processor meets the suggested requirements.
In most situations, it is advisable to aim for the suggested memory and number of CPU cores, as the minimum requirements does not guarantee good experience with no performance issues.
Related Information
Document Location
Worldwide
[{"Type":"MASTER","Line of Business":{"code":"LOB24","label":"Security Software"},"Business Unit":{"code":"BU059","label":"IBM Software w\/o TPS"},"Product":{"code":"SSBQAC","label":"IBM Security QRadar SIEM"},"ARM Category":[{"code":"a8m0z000000cwsyAAA","label":"Admin Tasks"},{"code":"a8m0z000000cwtiAAA","label":"Performance"}],"ARM Case Number":"","Platform":[{"code":"PF025","label":"Platform Independent"}],"Version":"All Versions"}]
Was this topic helpful?
Document Information
Modified date:
24 March 2023
UID
ibm16592987