Troubleshooting
Problem
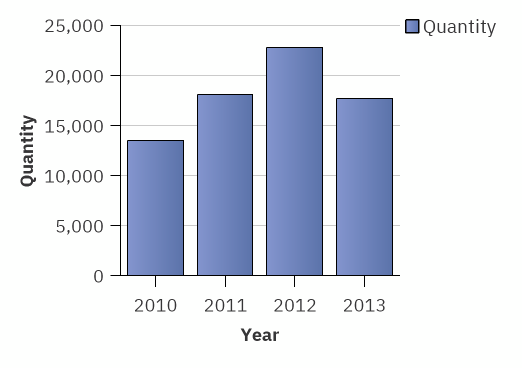
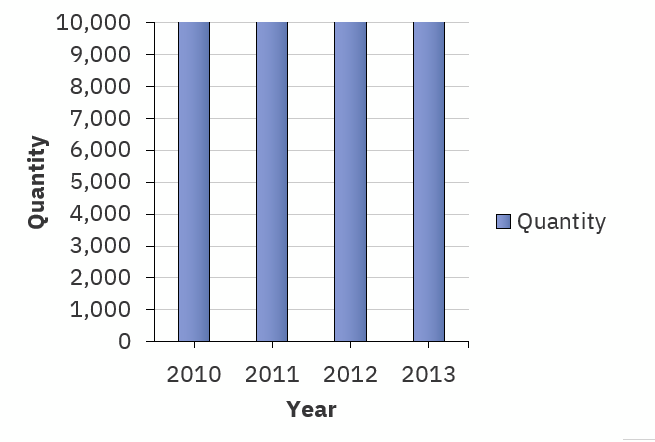
Bar chart values render to 100% of the Y axis when report exported to Excel. Issue does not occur when report run in HTML or PDF format.
Sample HTML output:
Sample Excel output:
Cause
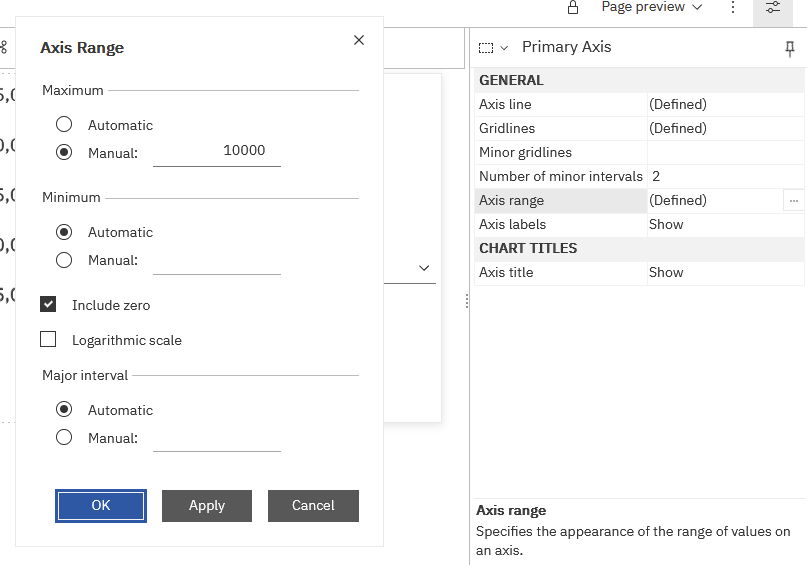
A Primary Axis - Axis range is defined:
Rendering the report in HTML or PDF, if the bar value is larger than the Maximum Axis range value, then the chart adjusts. In Excel, the chart adheres to the Maximum Axis range value and might not display 'properly'.
Resolving The Problem
Remove or adjust the Maximum Axis Range value for the Primary Axis.
Document Location
Worldwide
[{"Type":"MASTER","Line of Business":{"code":"LOB10","label":"Data and AI"},"Business Unit":{"code":"BU059","label":"IBM Software w\/o TPS"},"Product":{"code":"SSTSF6","label":"IBM Cognos Analytics"},"ARM Category":[{"code":"a8m500000008d78AAA","label":"Reporting"}],"ARM Case Number":"TS005764767","Platform":[{"code":"PF025","label":"Platform Independent"}],"Version":"All Versions"}]
Was this topic helpful?
Document Information
Modified date:
12 May 2022
UID
ibm16585734