News
Abstract
Audit journal support with IBM Navigator for i
Content
You are in: IBM i Technology Updates > Navigator for i > Audit Journal
IBM Navigator for i now contains the ability to view information from audit journals and configure auditing settings. Note that the following release and PTF groups must be installed to view detailed information for the corresponding entry types.
| Release | PTF Group | Services Available |
| 7.3 | SF99703 Level 26 | AF, CA, CD, CO, CP, DO, EV, GR, OW, PW, SV |
| 7.4 | SF99704 Level 28 | AD, AF, AP, AU, AX, CA, CD, CO, CP, DO, DS, EV, GR, JS, LD, M0, M6, M7, M8, M9, NA, OM, OR, OW, PA, PF, PG, PS, PU, PW, RA, RO, RZ, SK, SM, ST, SV, ZC, ZR, Data Mart |
| 7.5 | SF99950 Level 7 | AD, AF, AP, AU, AX, CA, CD, CO, CP, DO, DS, EV, GR, JS, LD, M0, M6, M7, M8, M9, NA, OM, OR, OW, PA, PF, PG, PS, PU, PW, RA, RO, RZ, SK, SM, ST, SV, ZC, ZR, Data Mart |
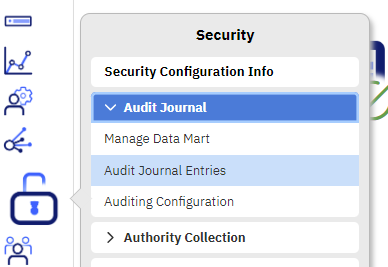
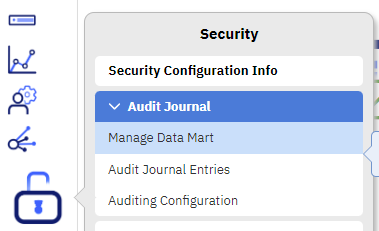
Under the security tab, click on Audit Journaling:
You will be prompted to choose between three views: daily chart view, weekly chart view, and detail view. By default daily chart view is selected.
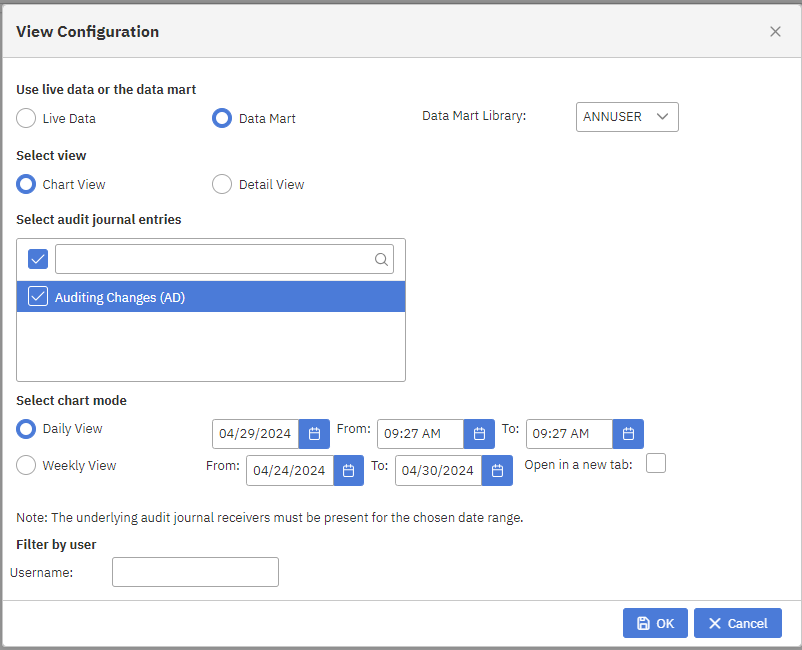
Configure view
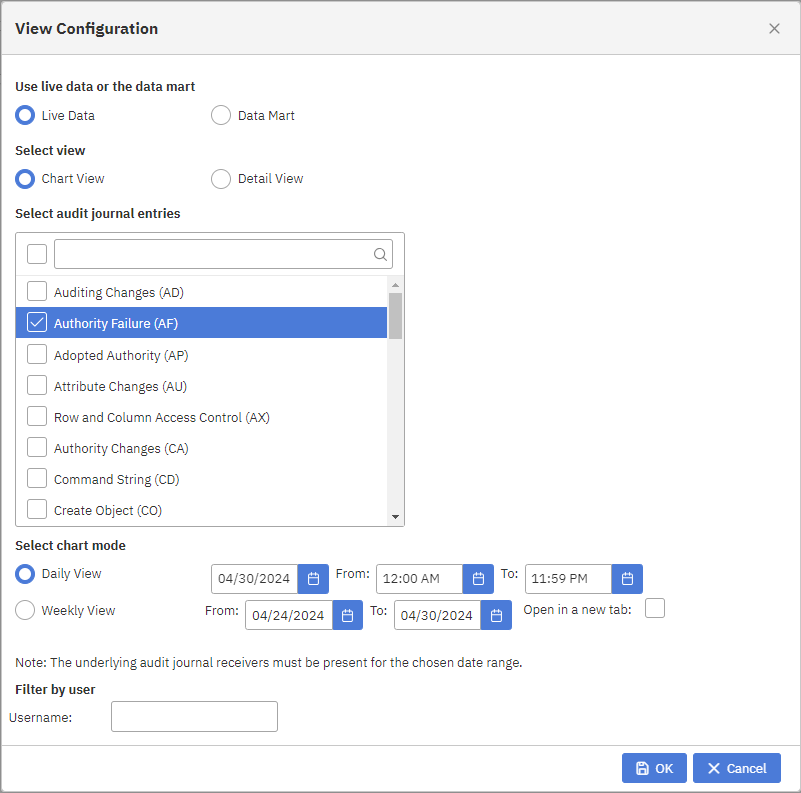
The configure view dialog also allows you to choose to use live data or the data mart. Live data will use the SYSTOOLS.AUDIT_JOURNAL_XX services, while data mart table will use the data mart tables in the specified library. You can choose what entry types and the date and time ranges you want to see data for. Depending on the view you select, you can also choose the graph color, sort, and auto refresh interval. Note that the more entries or longer time range you select, the longer the data will take to load.
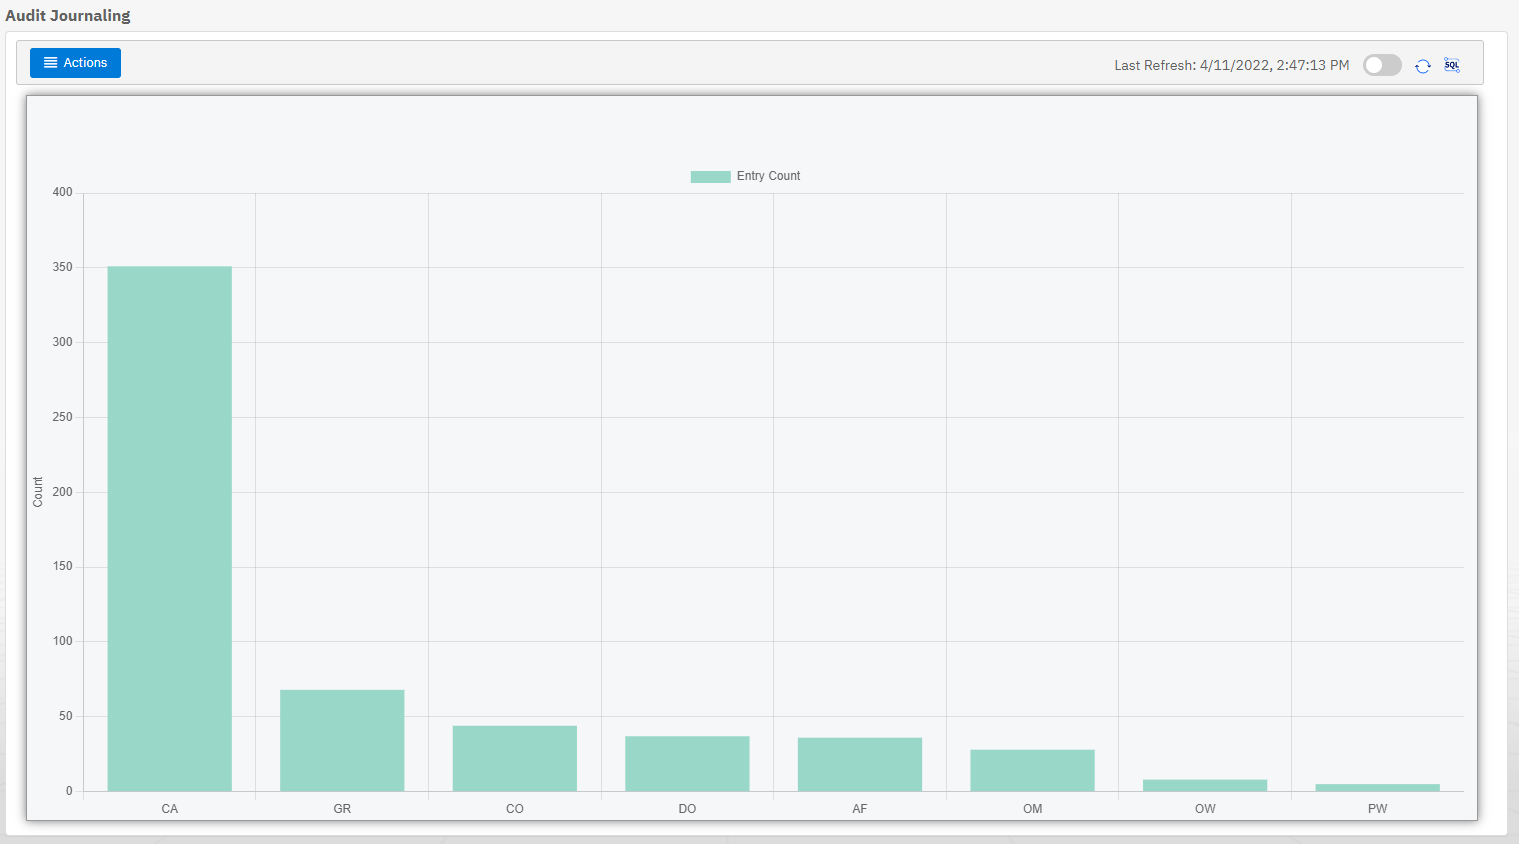
Daily chart
The daily chart view shows a graph of entry counts by entry type. Hover text on each bar displays the full entry name and count value. You can double click on a bar to go to the detail view for that entry type.
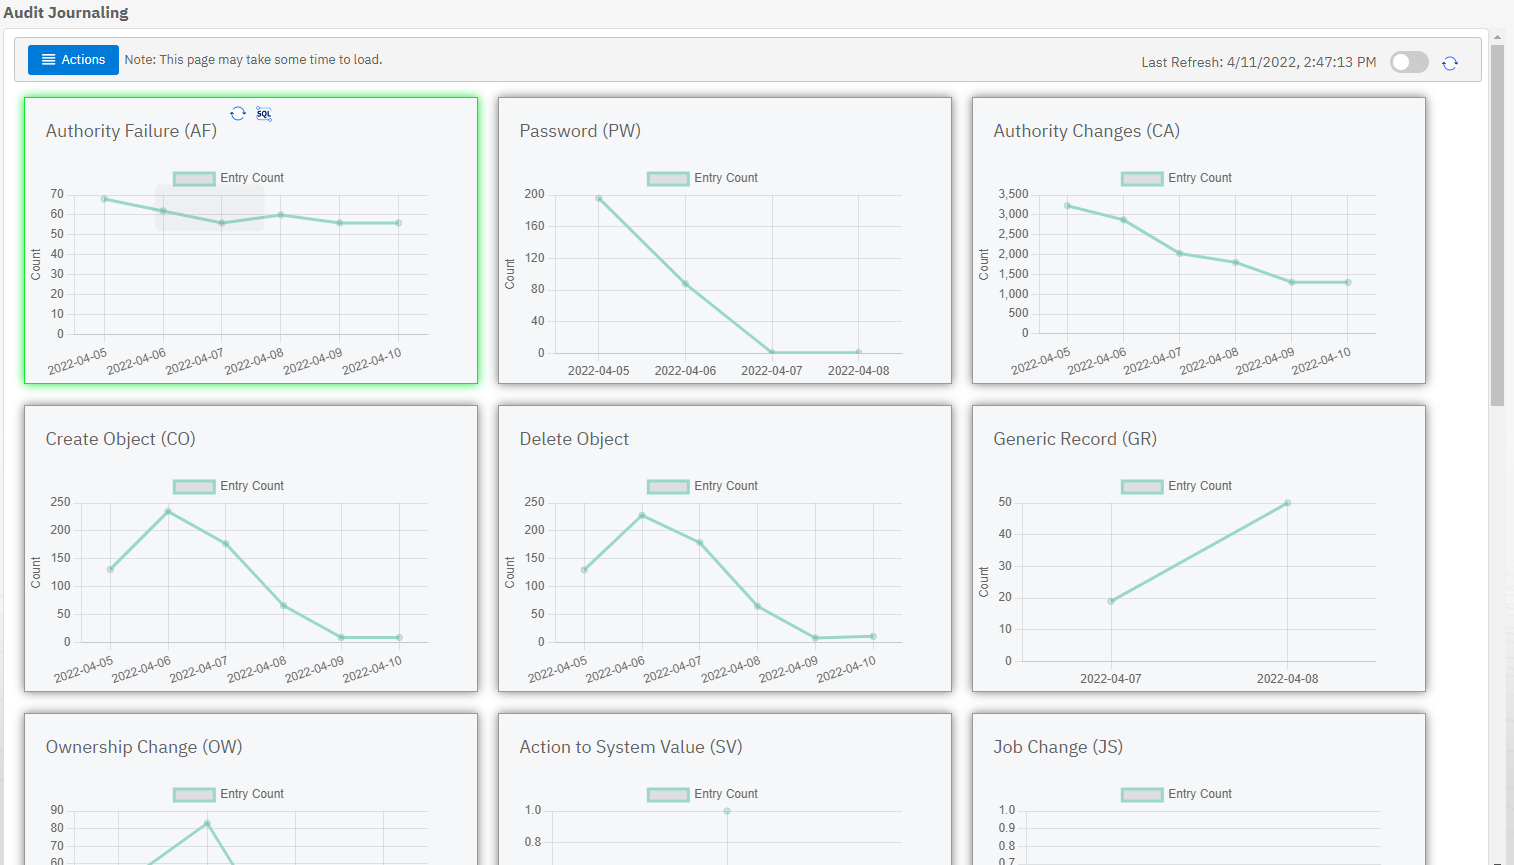
Weekly view
Similarly, weekly view shows entry counts over the selected date range for each entry type. You can hover over each chart to refresh it and view the SQL command used to generate the chart. You can also double click on the chart to go to the detail view for that entry type.
Detail view
Detail view pulls data from the audit journal entry services and displays it in a table. If you navigate to this view from the daily chart view or weekly chart view, you will see data for the date and time or date range that you selected respectively.
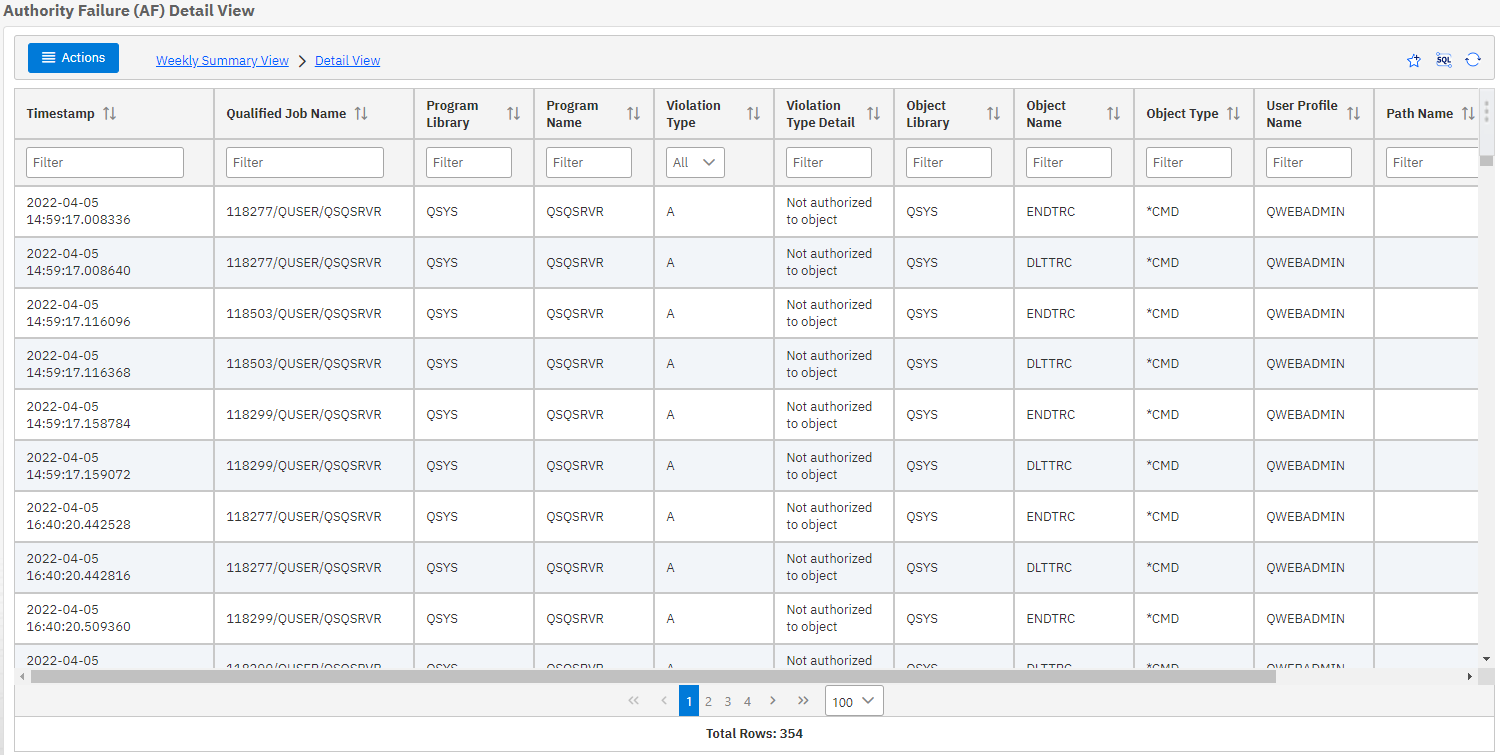
Breadcrumbs
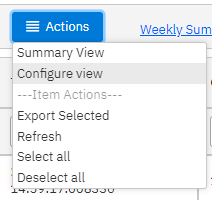
The breadcrumbs allow you to navigate back to the chart view that you came from. Alternatively, you can click Configure view in the Action menu to reconfigure the options you selected.
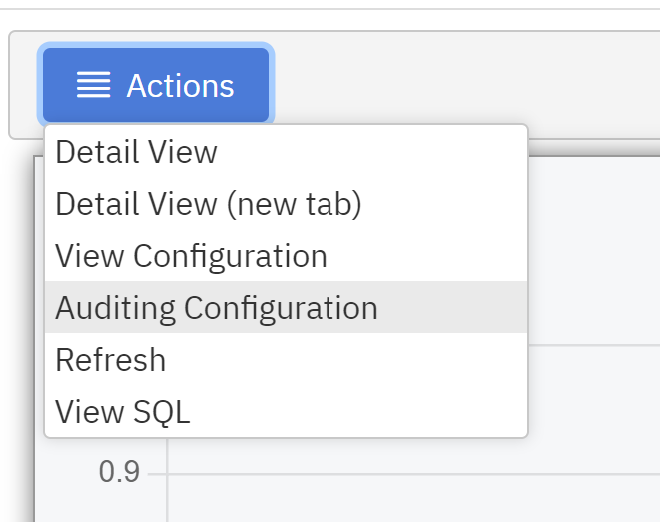
Audit configuration
Under the action menu from from Security > Audit Journal, click Audit Configuration.
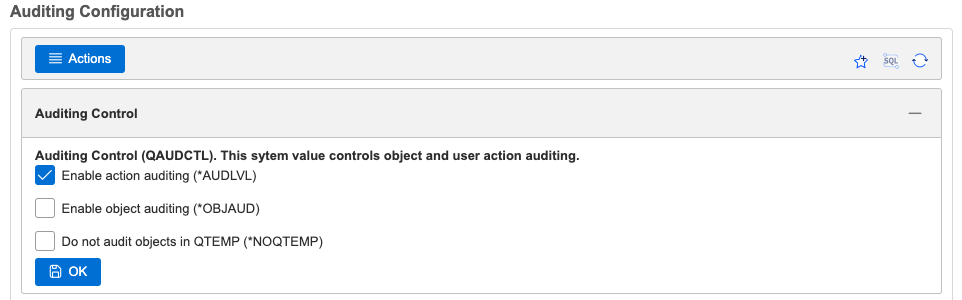
The audit configuration view allows you to see what audit actions are enabled on the system and the entry types that are generated. You can enable or disable an auditing action by clicking on the switch in the enabled column.
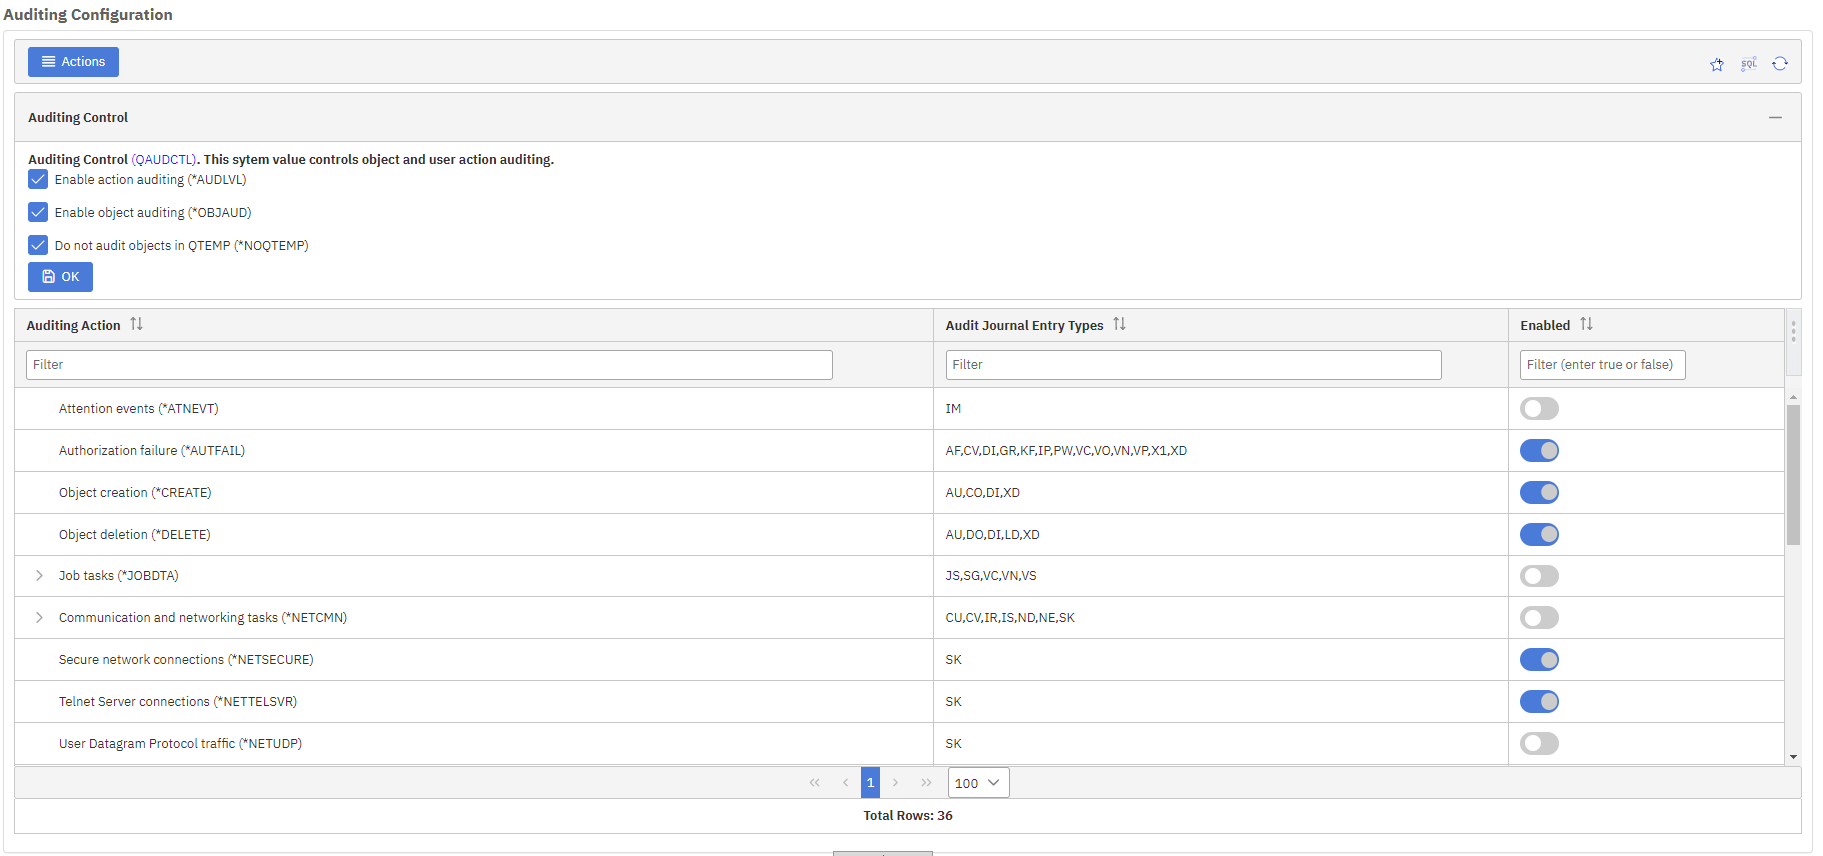
The System Value settings for Auditing are all handled in the Auditing Configuration.
QAUDCTL setting:
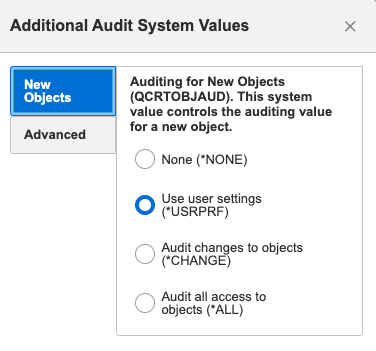
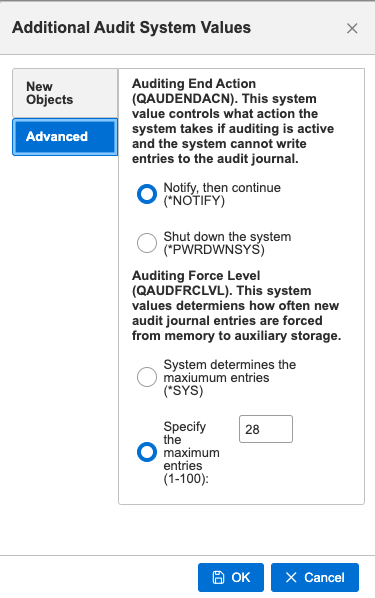
Use Actions > Additional Audit System Values action to set for New Objects, Auditing End Action, and Auditing Force Level:
Turn on Auditing
If auditing is not configured on the system, a dialog will be displayed that walks you through the set up. When you click OK, the journal and journal receivers will be created and system values will be set appropriately. Note that the journal receivers and library (if created) will be owned by the logged in user.

Data Mart
For large systems, loading audit journal data will be slow. The data mart functionality allows you to preload audit journal data into tables that Navigator can query against quickly. You must have *AUDIT special authority to use this feature. Under the security tab, click on Audit Journaling -> Data Mart.
You will be presented with a table that shows all the data mart tables on the system.
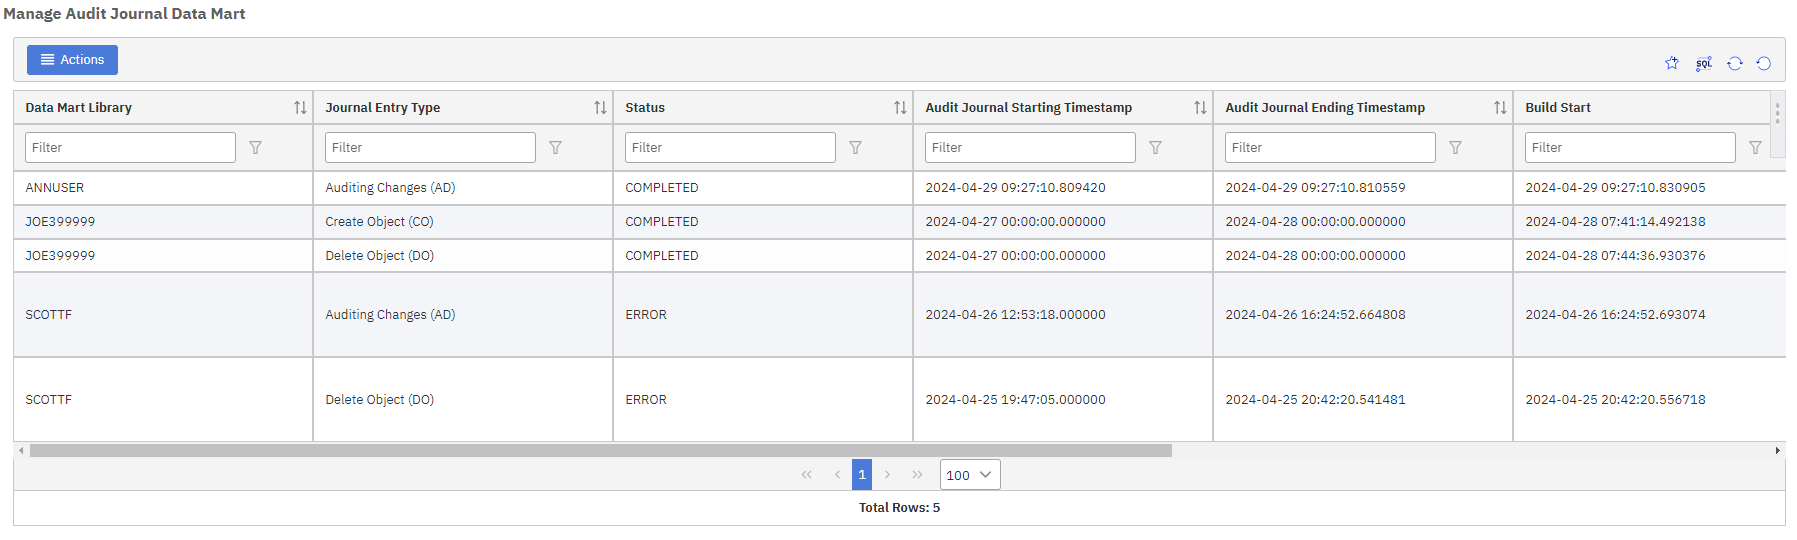
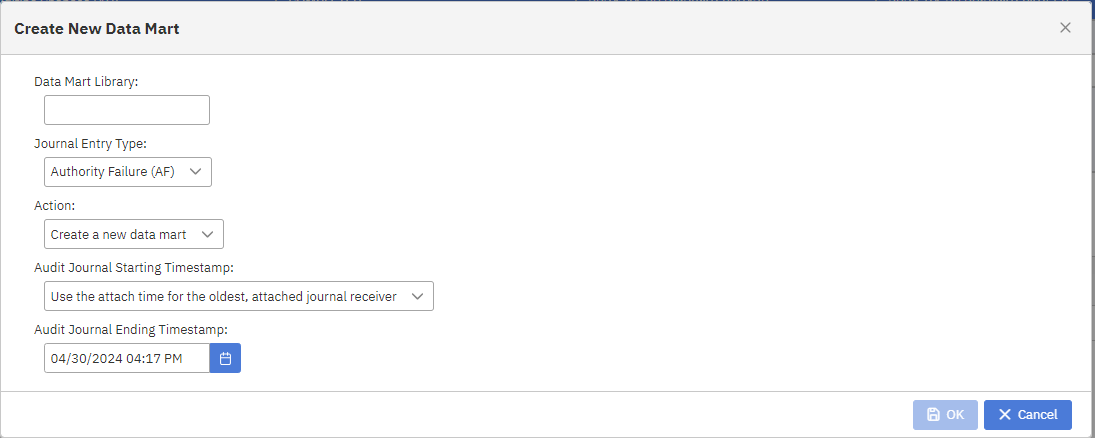
You can create a new data mart by clicking Actions -> Create New Data Mart. A dialog will be displayed that allows you to choose the library, journal entry type, and time range to create the data mart for.
Once a data mart table is created, you can manage it through the right click menu.
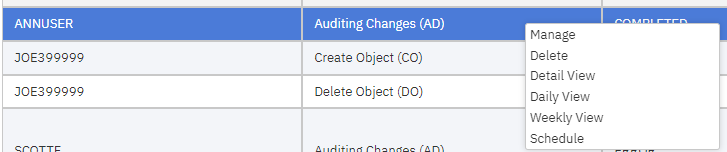
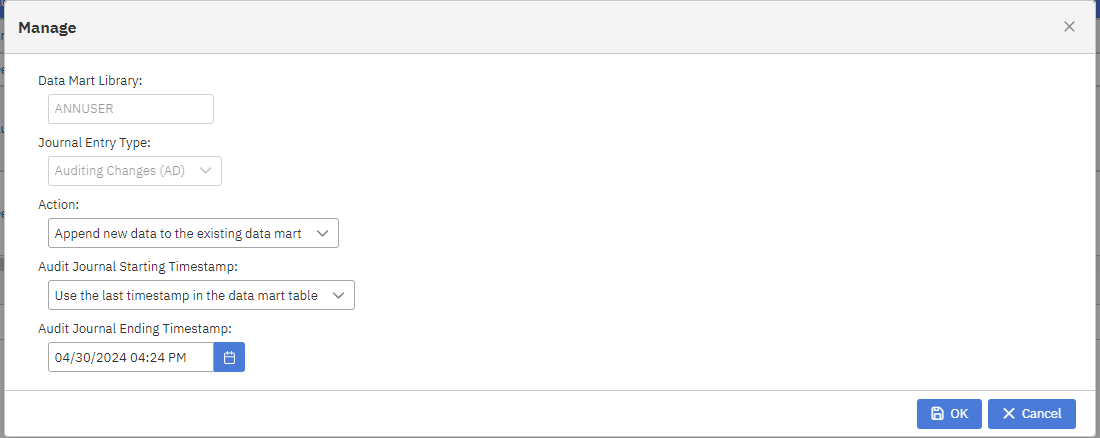
The Manage option allows you to add data to the table, remove data from the table, or replace the table for a specified time range.
The Delete action will delete the data mart table. The Detail View and Weekly View options will take you to the view configuration dialog and preselect the data mart table you clicked on.
The schedule option will allow you to create a scheduled job to add or replace the data mart table, so that management of the data mart table can be automated.
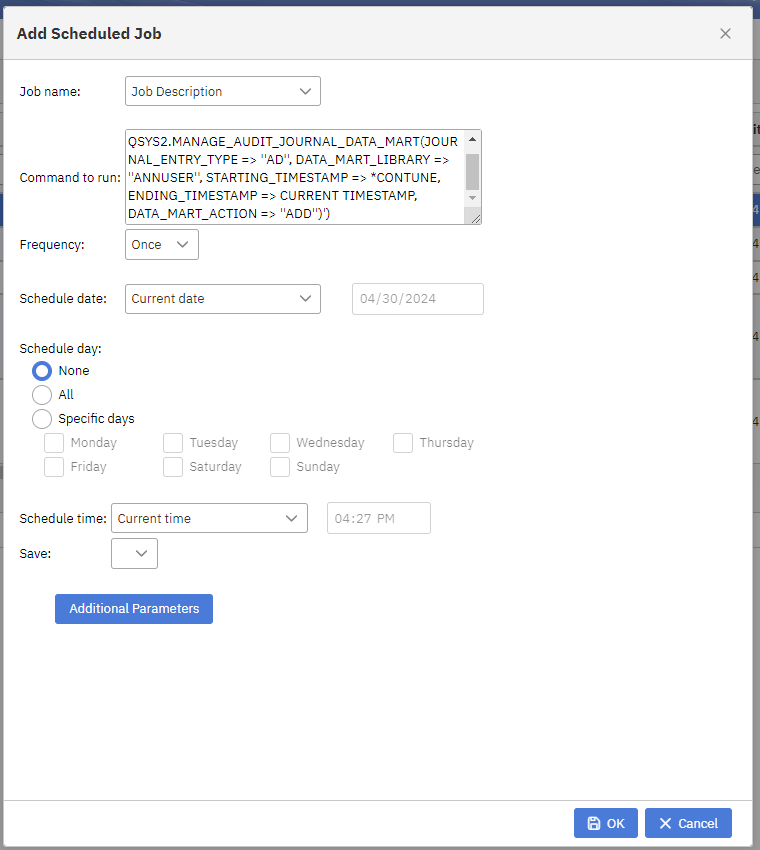
Note: the underlying audit journal receivers must be present for the selected date ranges to see data. You may also need the latest Db2 PTF groups to view detail data for each entry type.
[{"Type":"MASTER","Line of Business":{"code":"LOB68","label":"Power HW"},"Business Unit":{"code":"BU070","label":"IBM Infrastructure"},"Product":{"code":"SWG60","label":"IBM i"},"ARM Category":[{"code":"a8m0z0000000CH1AAM","label":"IBM Navigator for i"}],"Platform":[{"code":"PF012","label":"IBM i"}],"Version":"7.3.0;7.4.0;and future releases"}]
Was this topic helpful?
Document Information
Modified date:
11 June 2024
UID
ibm16570755