News
Abstract
HTTP access log contains a record of all inbound client requests handled by HTTP endpoints. You can enable access logging in the IWS server.
Content
What is it?
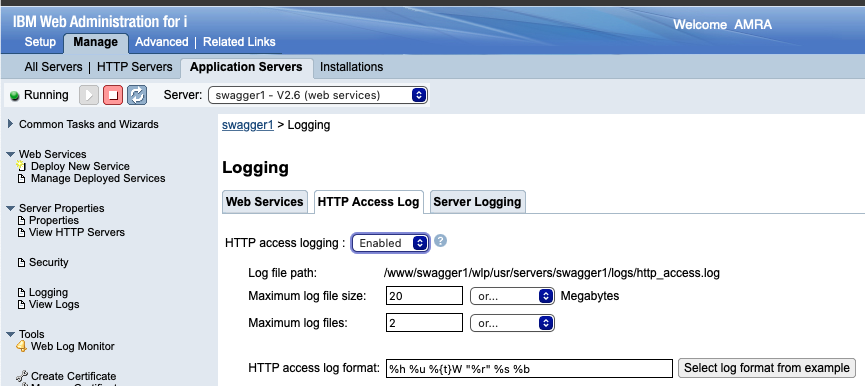
- HTTP access logging. Specifies whether to enable or disable application server HTTP access logging.
- Log file path. Directory path and name of the access log file.
- Maximum log files. Maximum number of log files that will be kept before the oldest file is removed; a value of 0 means no limit.
- Maximum log file size. Maximum size of a log file, in megabytes, that a log file can reach before being rolled over; a value of 0 means no limit.
- HTTP access log format. Specifies the log format that is used when logging client access information. The value for this property is a space-separated list of options. The order that you specify the options determines the format of this information in the log.
Each option can be enclosed in quotation marks, but the quotation marks are not required. Unless otherwise noted, a value of '-' is printed for an option if the requested information cannot be obtained for that option.The Following list indicates the available options and the information that is printed if that option is specified as part of the value specified for this property.
%a
Remote address.%A
Local IP address.%b
Response size in bytes excluding headers.%B
Response size in bytes excluding headers. The number 0 is printed instead of dash (-) if no value is found.%{CookieNmae}C or %C
The request cookie specified within the brackets, or if the brackets are not included, prints all of the request cookies.%D
The elapsed time of the request - millisecond accuracy, microsecond precision.%h
Remote host.%{HeaderName}i
The header name specified within the brackets from the request.%m
Request method.%{HeaderName}o
The header name specified within the brackets from the response.%q
Output the query string with any password escaped.%r
First line of the request.%{R}W
Service time of the request from the moment the request is received until the first set of bytes of the response is sent - millisecond accuracy, microsecond precision. The %{R}W option is often a good approximation for application response time (as compared to %D, which is end-to-end response time including client and network).%s
Status code.%t
NCSA format of the start time of the request.%{t}W
The current time when the message to the access log is queued to be logged in normal NCSA format.%u
Remote user according to the WebSphere Application Server specific $WSRU header.%U
URL Path, not including the query string.
Why use it?
Availability
The support is enabled in the following HTTP group PTFs and PTFs:
V7R3M0 SF99722 Level 38
V7R4M0 SF99662 Level 19
Was this topic helpful?
Document Information
Modified date:
27 March 2022
UID
ibm16566801