Troubleshooting
Problem
The IBM Security Guardium™ appliance comes with many useful predefined Reports intended to ease the monitoring and troubleshooting of many components of the system.
The "Aggregation/Archive Log" Report can be used to monitor the status of the processes known as Aggregation Tasks (Data Archive, Data Export, Data Import, Results Export, Results Archive, etc.) and the system backup, so it is a frequently used report.
Sometimes you can notice an error message when executing this report.
"Error in generating report/monitor: Error In SQL statement."
Symptom
When you open the Report from the GUI ("Reports > Guardium Operational Reports > Aggregation/Archive Log"), an error window is presented.

Cause
One or more internal tables are corrupted.
Environment
This technical note was created while working on an IBM Security Guardium™ v11.2 system. Most of the pictures shown are merely referential and based on this version.
The procedure presented hereby as the answer or solution should be equivalent in any version of IBM Security Guardium™ with slight differences. For that reason, it is recommended that you get familiar with the menus, paths and other GUI elements depending on the version of the product you are using and at the same time, consider the proper information that matches your environment, which includes, but is not limited to: IP addresses, hostnames, usernames, installation paths, mount points, etc.
Diagnosing The Problem
There are some different options to diagnose the issue, but two are very easy to perform.


Diagnosing option 1. By using the crashed tables lookup utility.
1. Log in to the command-line interface (CLI) of the IBM Security Guardium™ appliance.
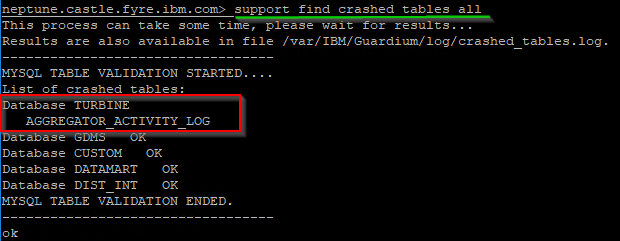
2. Execute the "support find crashed_tables all" CLI command.
support find crashed_tables all
3. The output of the command displays the tables marked as crashed, and its internal database name. If there are one or more entries with the string "AGGREGATOR" on its name, you are facing the problem reported.
Example.
Example.

Diagnosing option 2. By collecting the agg_issues support MustGather.
1. Log in to the command-line interface (CLI) of the IBM Security Guardium™ appliance.
2. Execute the "support must_gather agg_issues" CLI command.
support must_gather agg_issues
3. The command output can display errors to locate one or more database files.
Example.

|
Note 1. The meaning of the error message "du: cannot access `/var/IBM/Guardium/data/mysql/GDMS/AGGREGATOR_ACTIVITY_LOG" is that not all Guardium™ appliances (specially Aggregators) use a database named GDMS.
The GDMS database is only used in environments where the data retention age is greater than 90 days and/or there are more than 10 Collectors exporting data to the Aggregator.
Irrespective of the above, you must pay attention to the file name. If there are one or more entries with the string "AGGREGATOR" on its name, you are facing the problem reported, and you must use TURBINE as the database name of the corresponding repair command. |
Resolving The Problem
1. Log in to the command-line interface (CLI) of the IBM Security Guardium™ system.
2. Stop the GUI.
stop gui
3. Execute the "support repair crashed_table <DATABASE_NAME> <TABLE_NAME>" CLI command, one for every crashed table found.
|
Note 2. The "support repair crashed_table" command receives two parameters.
<DATABASE_NAME>. It is the name of the internal database of the appliance storing the crashed table. To troubleshoot the specific problem documented hereby, you will always use the name TURBINE, even in scenarios where an error message refers to another database, named GDMS.
<TABLE_NAME>. Represents the name of the table to be fixed.
|
Example.
In the example given, a table named "AGGREGATOR_ACTIVITY_LOG" was found as crashed. Then, the command to be executed is: "support repair crashed_table TURBINE AGGREGATOR_ACTIVITY_LOG".

4. If the repair completed successfully, restart the GUI.
restart gui
5. Open the GUI again. Navigate to "Reports > Guardium Operational Reports > Aggregation/Archive Log". The report should work now.

Related Information
Document Location
Worldwide
[{"Type":"MASTER","Line of Business":{"code":"LOB24","label":"Security Software"},"Business Unit":{"code":"BU059","label":"IBM Software w\/o TPS"},"Product":{"code":"SSMPHH","label":"IBM Security Guardium"},"ARM Category":[{"code":"a8m0z000000Gp0LAAS","label":"AGGREGATION"},{"code":"a8m0z0000000AqcAAE","label":"GUI"},{"code":"a8m0z0000001erNAAQ","label":"REPORTS"}],"ARM Case Number":"TS005136196","Platform":[{"code":"PF025","label":"Platform Independent"}],"Version":"All Versions"}]
Was this topic helpful?
Document Information
Modified date:
26 August 2021
UID
ibm16483269