White Papers
Abstract
Db2 Analytics Accelerator on Z is a container application for IBM Secure Service Container (SSC). SSC is a special Logical Partition (LPAR) that can reside on the same Central Processing Complex (CPC) as the Db2 for z/OS subsystem or on a different CPC. One of the main advantages of IBM Db2 Analytics Accelerator on Z over IIAS is IFL, Memory and Storage can be scaled independently. This configuration advantage provides better scalability and allocate resources dynamically as needed.
Db2 Analytics Accelerator on Z is powered by Db2 Warehouse, the new acceleration engine for Db2 Analytics Accelerator Version 7. Few advantages of this new technology are in-memory column store which uses a dynamic movement of data from disk to memory so that even workloads that are bigger than real memory can benefit, Data Compression features provided by Db2 Warehouse engine.
In this tech note, it is focused to monitor IFL, Memory and Storage on Db2 Analytics Accelerator on Z and if there is a need to change the configuration, points are provided to make it happen
Content
The CPU usage in Db2 Analytics Accelerator is often counter-intuitive for "standard Z users". The design priority of Db2 Warehouse is to get a query processed as fast as possible and use all available resources. A single (complex) query may use nearly 100% of the user CPU if everything is well. This is different from, for example, Db2 for z/OS and other z/OS workloads that are optimized for highly concurrent workloads, and where the CPU usage is an indication of the system load.

It is suggested that the CPU capacity should be based on how Db2 Analytics accelerator fulfils SLAs. For instance, if queries finish typically in 10 seconds, but the the SLA requires 20 seconds - then you might reduce the number of IFLs. But reality is more complex - you will also have to consider load and incremental update operations. Often load jobs must fit in a batch window and incremental update is required to be below a certain latency.
Analytics Accelerator Studio can display the latest queries that have been accelerated in the Query Monitoring section of the Accelerator view: The CPU Time column shows the seconds consumed by the IFL resource for a SQL query.
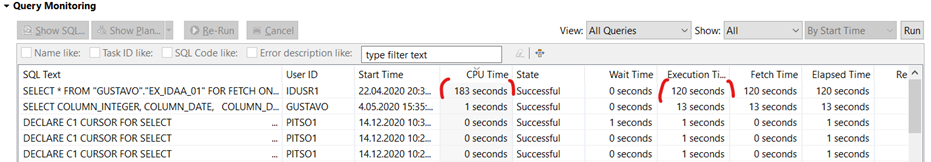
The same information can be accessed by using the SYSPROC.ACCEL_GET_QUERIES stored procedure that comes with the product. For more information, see:
If this data is collected and stored in a Db2 table, a CPU usage analysis can be done easily. The details of collecting the query history can be found here; https://www.ibm.com/support/pages/node/594099
Another area to monitor CPU utilization is the Monitoring section in Data Studio.

Q8STCCPU : The current average CPU utilization on the coordinator nodes of the accelerator
Q8STWCPU: The current average CPU utilization on the worker nodes of the accelerator
For a single-node or multi-node implementation of Db2 Analytics Accelerator on Z, Q8STCCPU and Q8STWCPU counters show the same value, which is the CPU utilization in percentage.
In general, it is possible to use shared IFLs, but if even if you define 2x IFLs, Db2 Warehouse would still try to use all. But due to the sharing, one would observe "stolen time", that is, CPU resources assigned to other LPARs while Db2 Analytics Accelerator would be in a runnable state. This is, however, no indication for the actual CPU demand of Db2 Analytics Accelerator
Db2 Analytics Accelerator runs in SSC LPARs that use IFLs. Therefore, if there is more than one Db2 Analytics Accelerator or Linux on Z LPAR, IFL resources can be shared between these LPARs.
Most z/OS customers monitor LPARs for CPU and memory consumption. Typically, they do this for capacity management and planning. The same physical measurements for Db2 Analytics Accelerator are not adequate for this purpose. There are cases in which some capacity judgements are possible.
If the number of IFLs or the size of the memory needs to be changed (added or removed), the recommendation is to always change the number of IFLs in the activation profile from the Hardware Management Console (HMC) and to perform a re-activation. The reason is that a running Db2 Warehouse will not become aware of the IFL change without a restart. So adding the IFL online may result in a sub-optimal performance if there is no restart.
Monitoring Memory
The way Db2 Warehouse works is that it grows its memory areas up to preset limits. In most cases, memory is not returned to the operating system, that is, the high-water mark stays where it is.
For example, if 60% memory utilization were never surpassed, then most probably, memory is overprovisioned (80%-100% utilization are expected). But this does not work the other way around, that is, the conclusion that 90%+ memory utilization most of the time does not necessarily indicate a shortage of memory.
The bufferpool hit ratio and the sort overflow are used as indicators for memory requirements. The -DISPLAY ACCEL command displays information about accelerator servers. In addition, there are two counters for memory
https://www.ibm.com/support/knowledgecenter/SSEPEK_12.0.0/comref/src/tpc/db2z_cmd_displayaccel.html
Total Memory Available for User Data(Q8STTMUD) shows a single Db2 Warehouse bufferpool for all connected Db2 subsystems. This is not the physical memory of the accelerator, but the memory configured for bufferpools across all worker nodes. The bufferpool size is determined when you start the cluster for the first time. So after increasing the memory on the HMC, it is necessary to restart and reprovision the bufferpool. If the memory is increased in the LPAR, the instance memory and bufferpool sizes are adjusted when the docker container is restarted.
![]()
Total Memory Available for SQL Processing(Q8STTMPS) shows memory available for the processing of SQL statements in the accelerator.
![]()
There are also two other counters can be found from the SMF Statistics Trace.
The Buffer Pool Hit Ratio %‘(Q8STABHR) gives an important overall measure of how effectively the system uses memory to avoid a disk I/O failure. Values greater than 95% are considered to be good. Lower values over a longer period for a given workload may indicate that the memory size of the acceleator is too small to execute the workload with an optimal performance and needs to be increased. In general, the best way to see whether there is enough memory for a workload is to monitor the buffer hit ratio. During "normal operations", this ratio should be greater than 95 % - after all it is good to have in-memory processing. It could drop occasionally, for example, if there is a workload change requiring a new working set. For example, if there is interactive usage at daytime and batch reporting at night-time.
Sort Overflow (Q8STOFLW) is the number of sort overflows in the accelerator. A sort overflow means that SQL statements could not be processed entirely in memory. Results are “spilled” to a system temporary table and this might require disk access. Many sort overflows that occur over a longer period may indicate that the accelerator memory is too small to execute the workload with an optimal performance. If the system temporary table space is frequently used, this does not necessarily indicate a problem. However, to increase the performance of analytical workloads with a very high demand for memory, it is vital to use fast storage. To this end, make sure that alias devices are defined for FICON storage devices and that fast flash drives are used for the accelerator data pool whenever possible.
Monitoring Storage
External storage has to be provided to Db2 Analytics Accelerator on Z. The storage is required for storing the accelerator appliance image and the accelerator database including the user data, which consists of the tables that are loaded or archived to the accelerator or that are created as accelerator-only tables. Additionally, storage is required for temporary data of the accelerator runtime. The accelerator can use FICON storage or FCP-attached storage. There are no specific requirements for storage systems. The accelerator requires multiple storage “pools” for the runtime (>80 GB), for operation (>40 GB) and for data (the size depends on user data). Besides, a different storage system or type of storage can be used.
There are 3 areas for space monitoring for Db2 Anayltics Accelerator on Z
3. The disk space that is used. On Linux, it is determined by the 'df' command at the filesystem level for the /data volume which includes free pages in the table space that are currently not used.
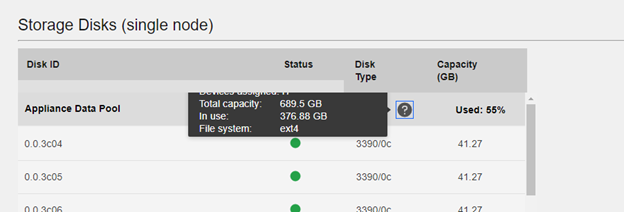
It is suggested that monitor #2 for table sizes, #3 for the storage in files system. The DISPLAY ACCEL command has two counters for storage as well.
https://www.ibm.com/support/knowledgecenter/SSEPEK_12.0.0/comref/src/tpc/db2z_cmd_displayaccel.html

Q8STDSKA : Total disk capacity (for user data) in MB
Q8STDSKB: Disk space (in MB) for data related to this Db2 subsystem. This value can be related to Q8STDSKA to determine how much disk capacity has been used.
You can add storage without a downtime of the accelerator. Once you prepare the volumes, the JSON configuration file needs to be changed and following link provides details on how to change it. The accelerator continues to work. If you have added storage in your configuration file, the corresponding disk drive is formatted.
Product Synonym
Db2 Analytics Accelerator on Z
Was this topic helpful?
Document Information
Modified date:
23 March 2021
UID
ibm16416467