Question & Answer
Question
Cause
Answer
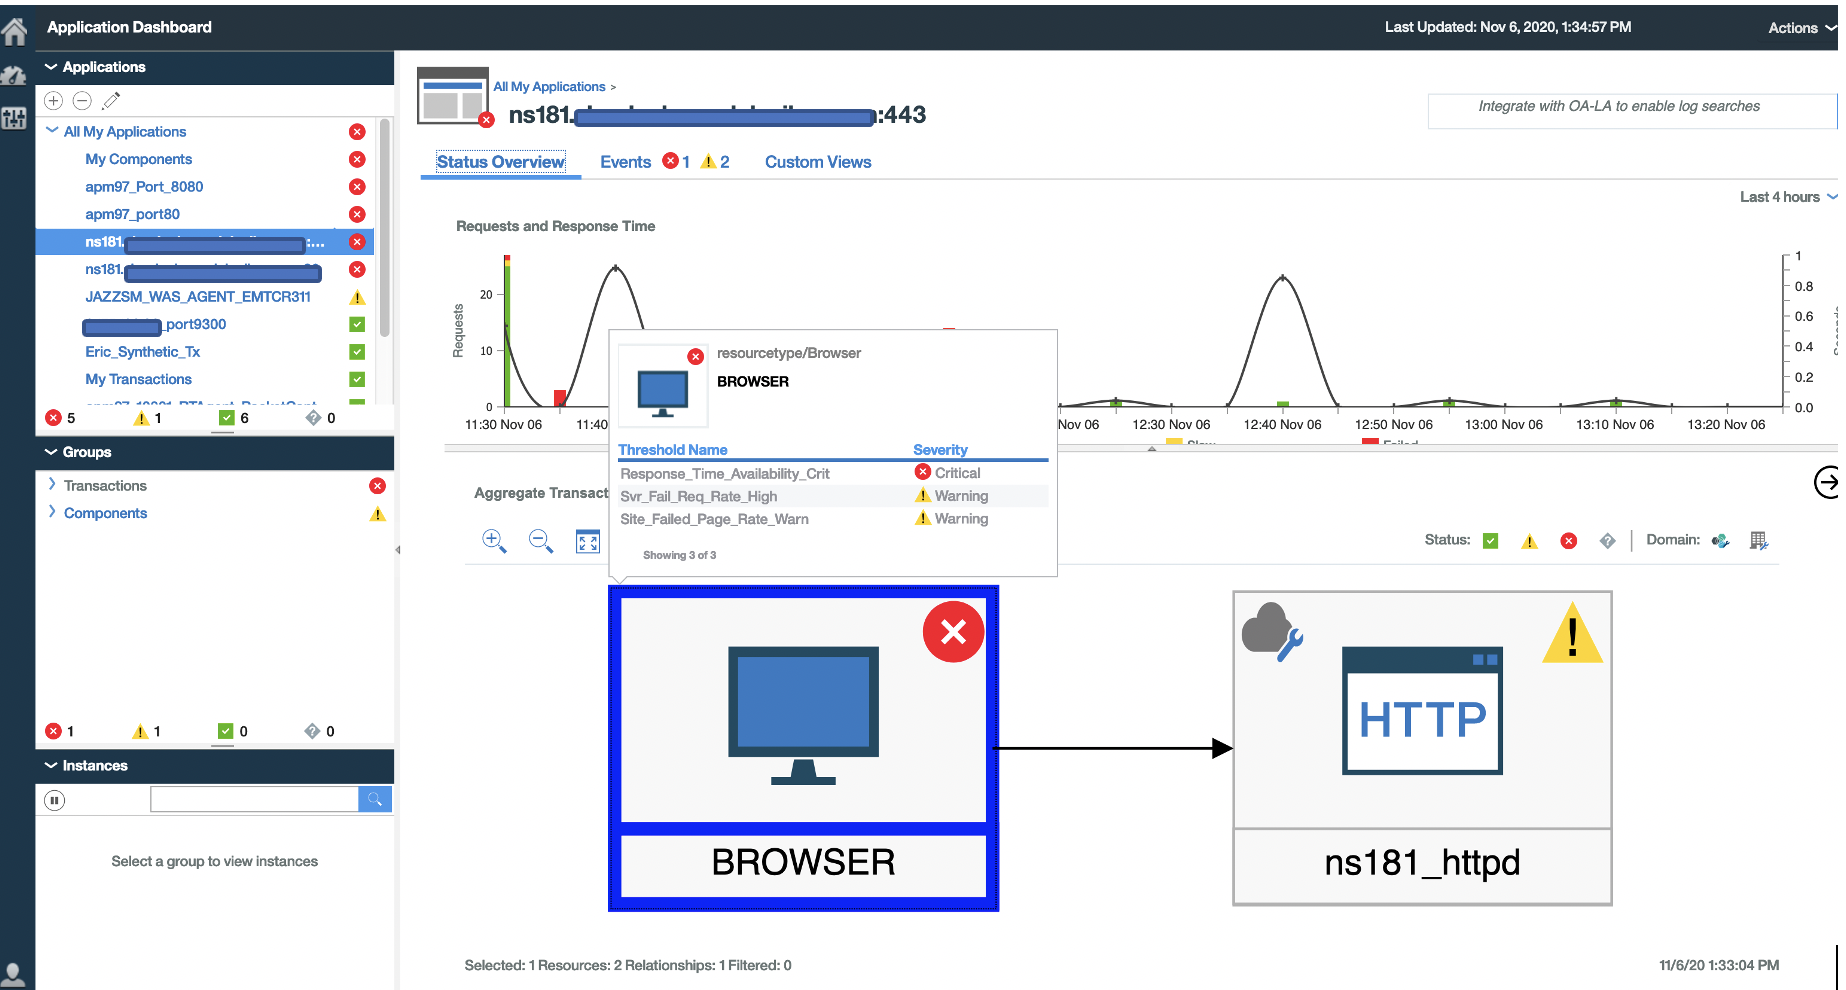
Example of a application monitored by HTTP server agent (HU) and Response Time agent (T5)
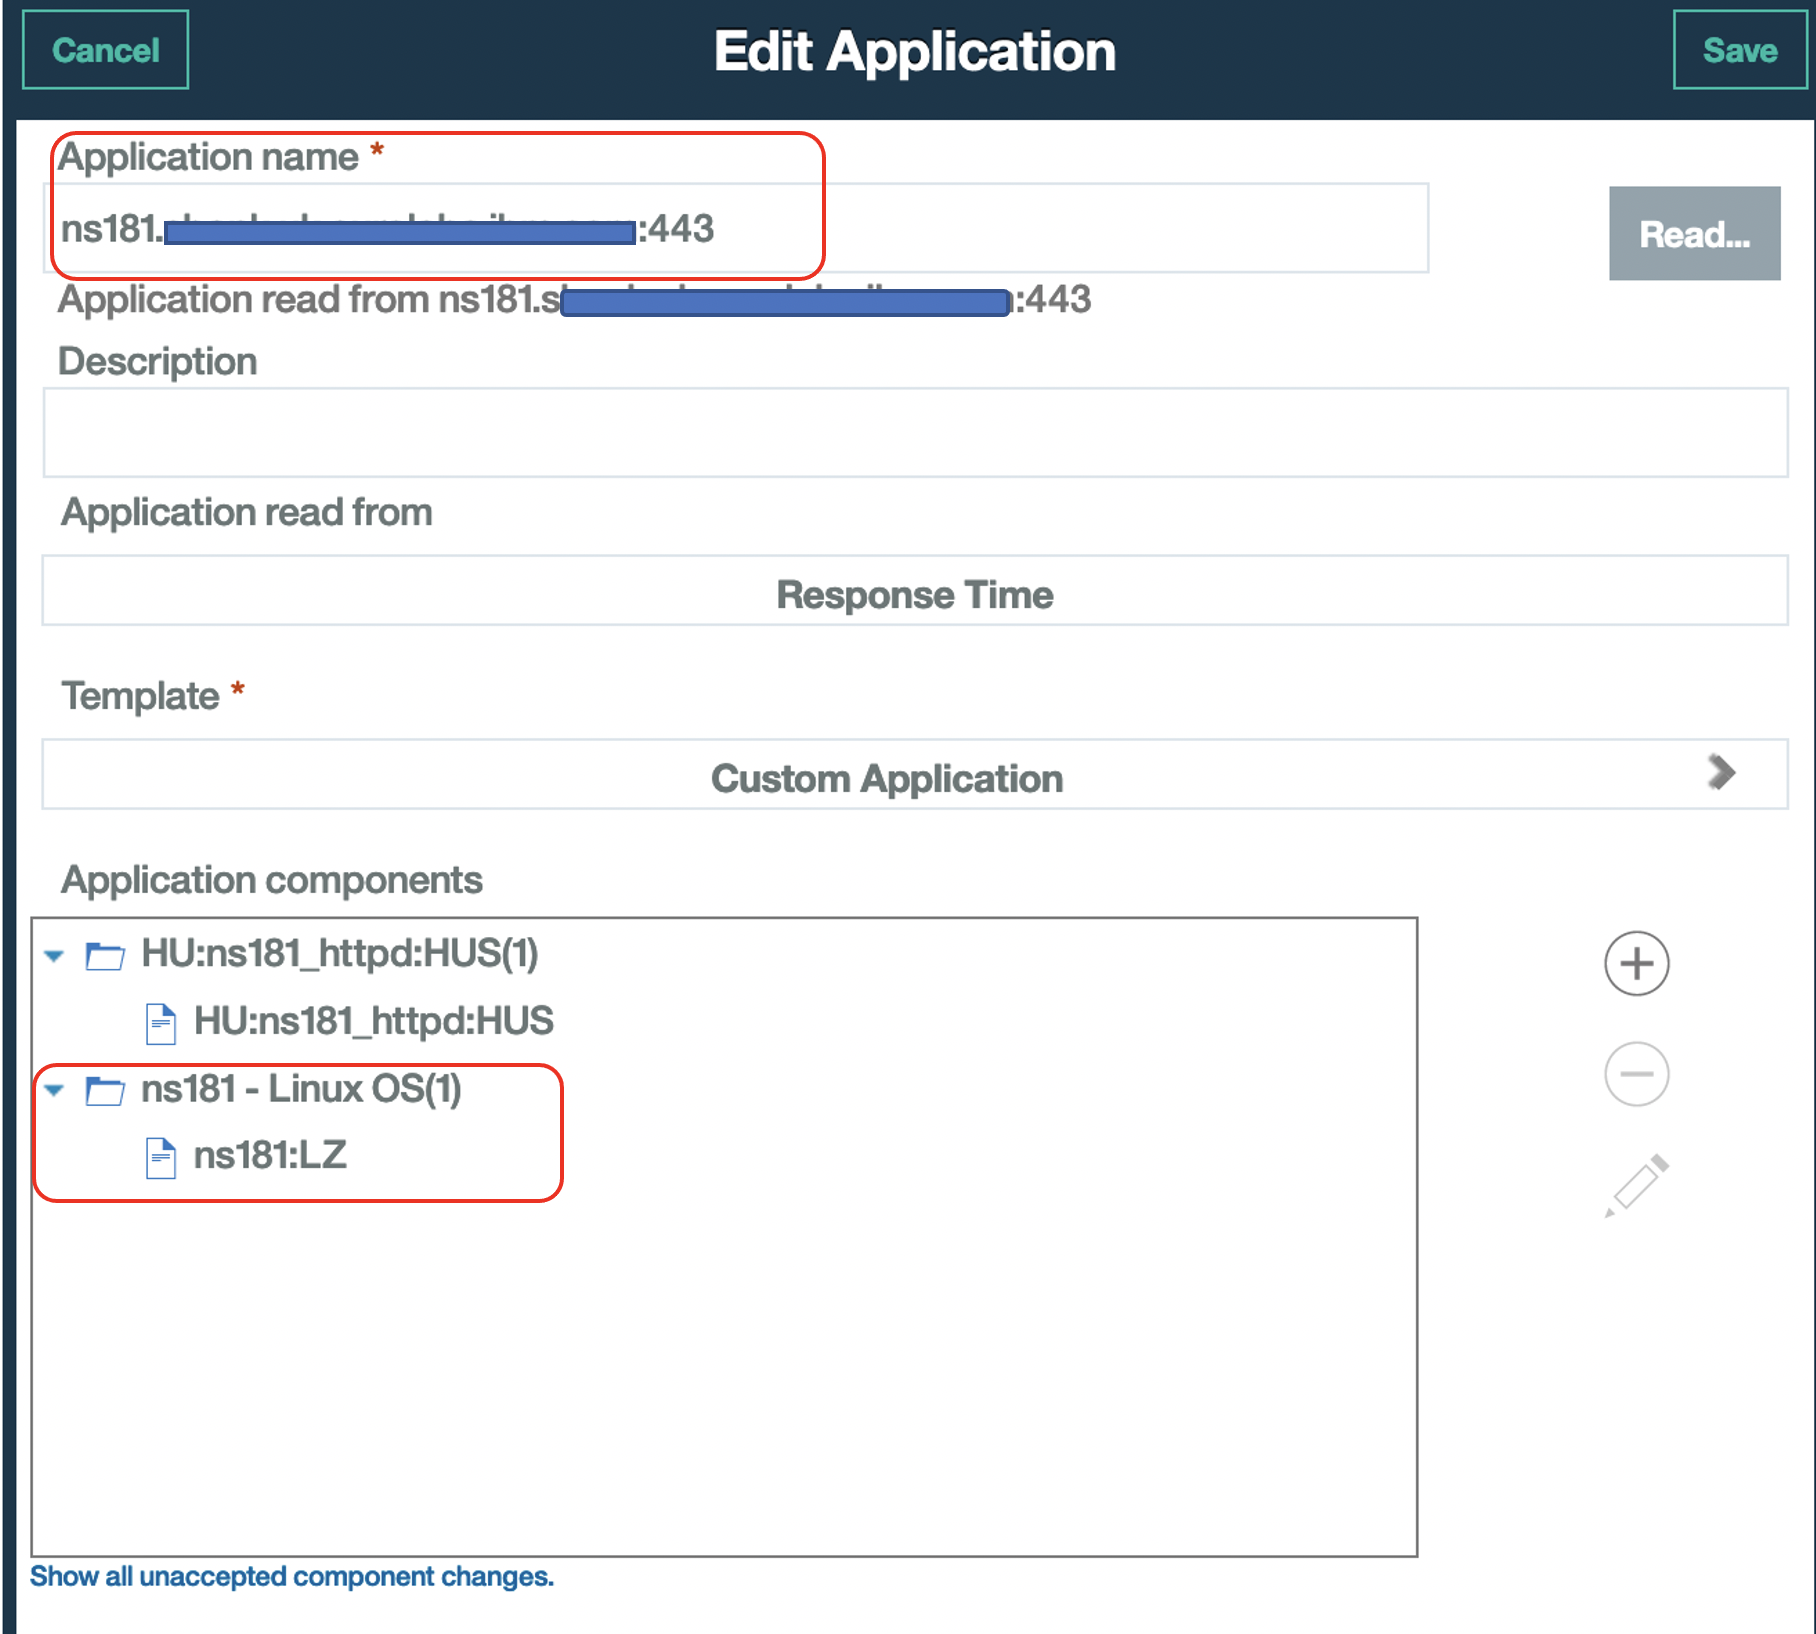
1)
The Application : ‘ns181….:443’ was defined with 2 components (one being the Linux OS agent)
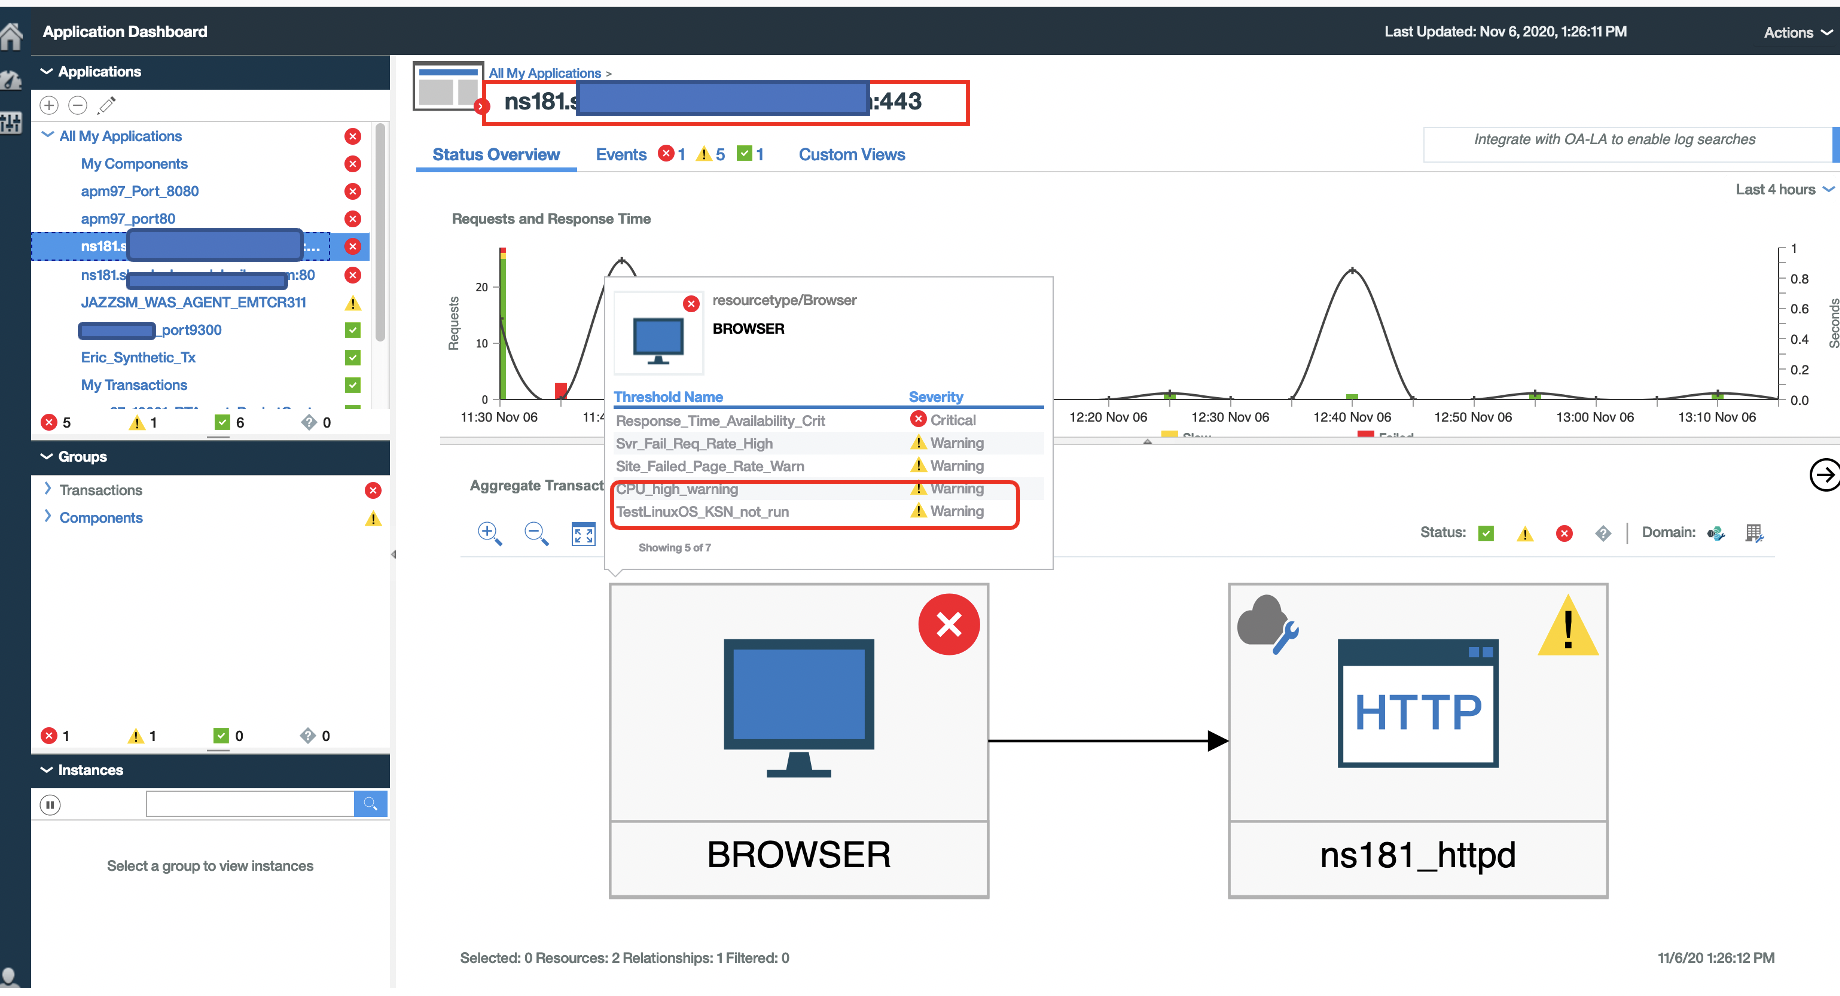
As a consequence, the ‘Browser’ component in ‘Aggregate Transaction topology’ widget in APM dashboard is showing alerts/threshold coming from Linux OS agent.
2)
I changed the application settings as below (so I left only one Application component, like HU:<host>_httpd:HUS) :
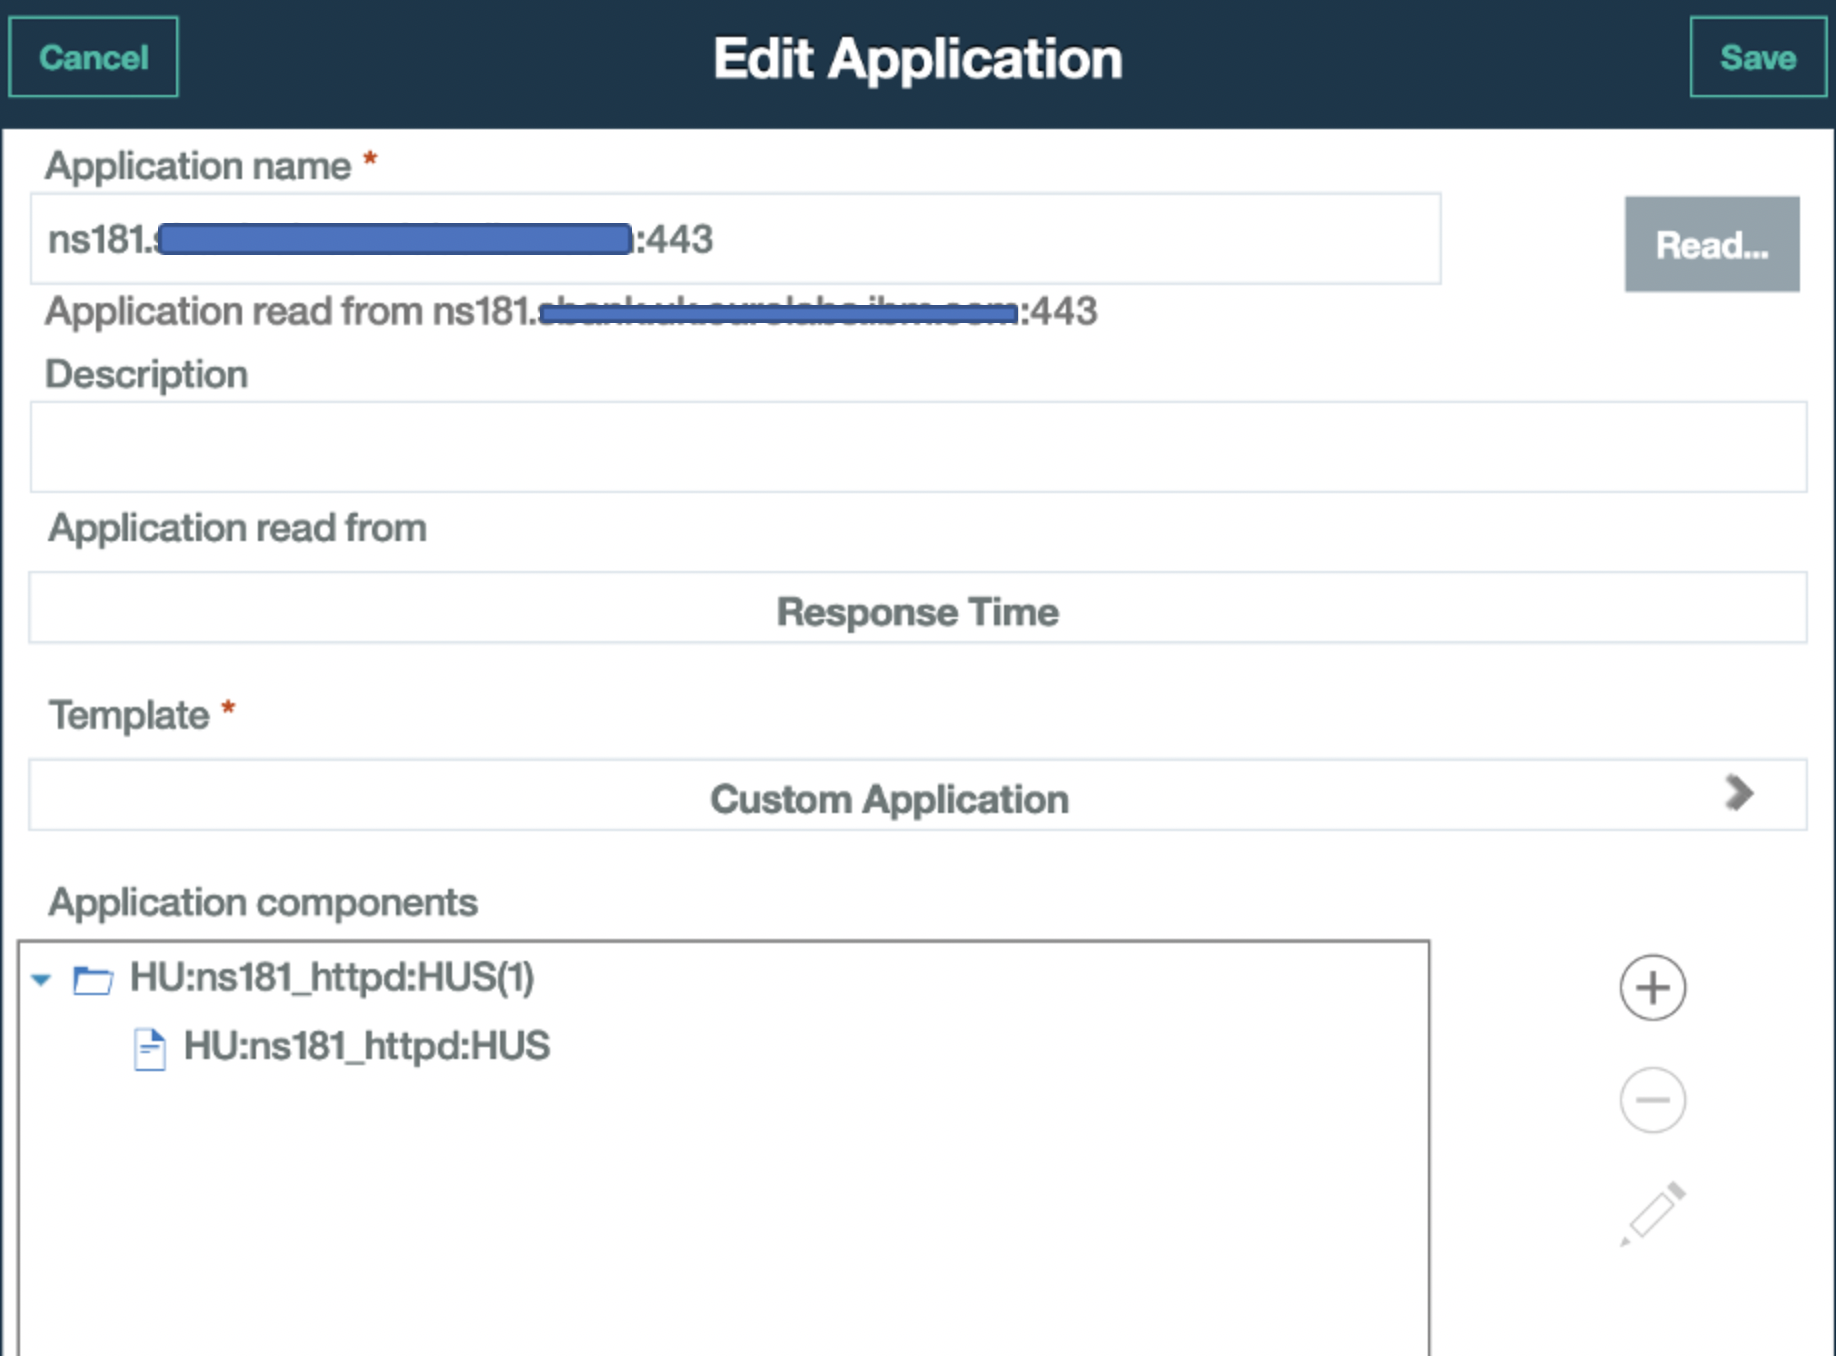
Results: no more Linux OS agent’s threshold coming from :LZ source:
And No alert/threshold for Browser component from LZ agent source.
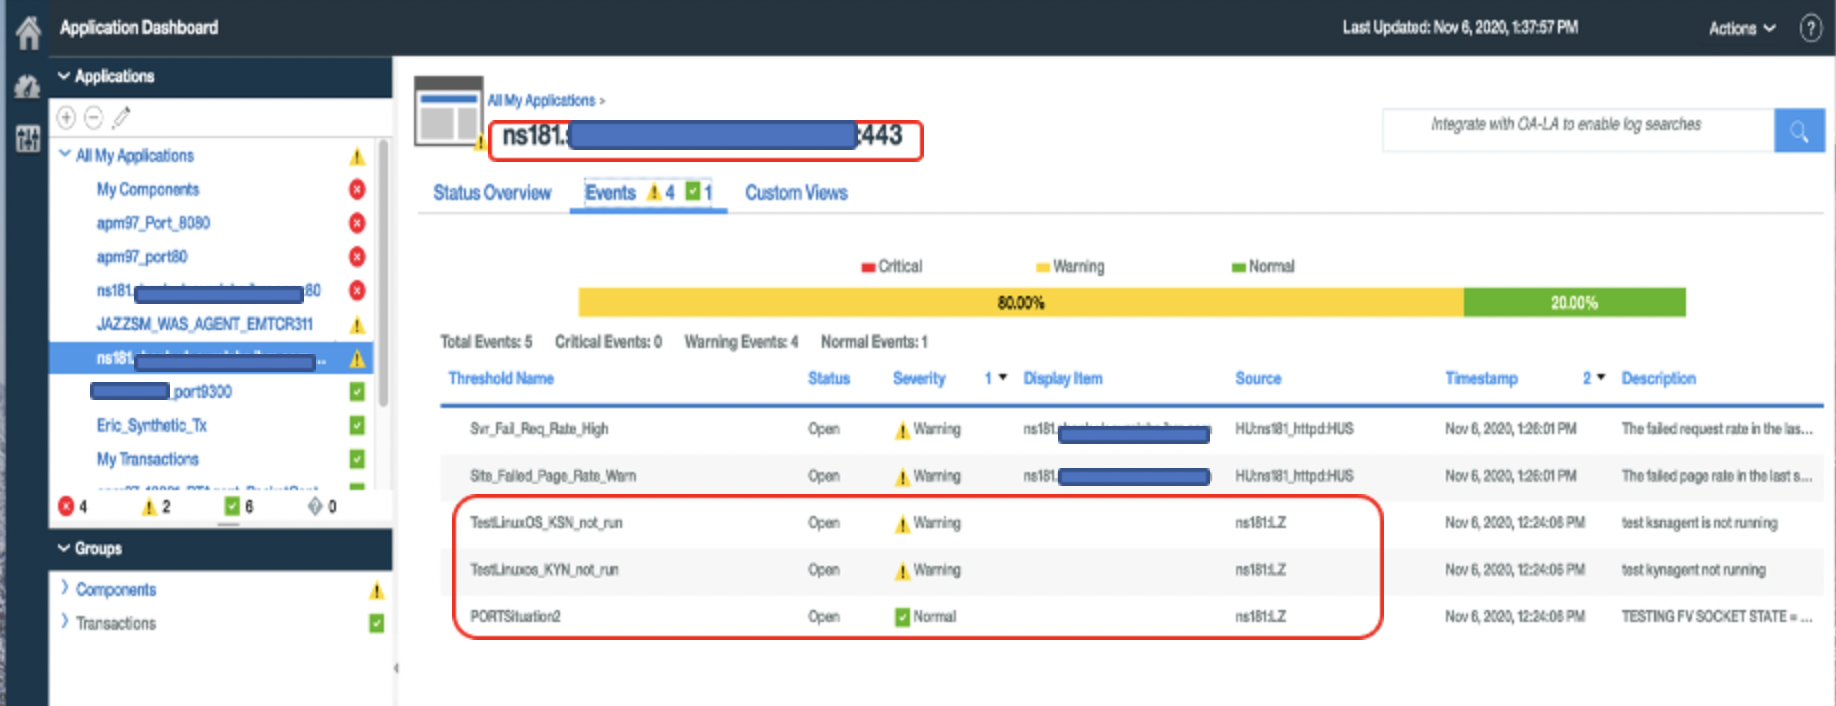
3)
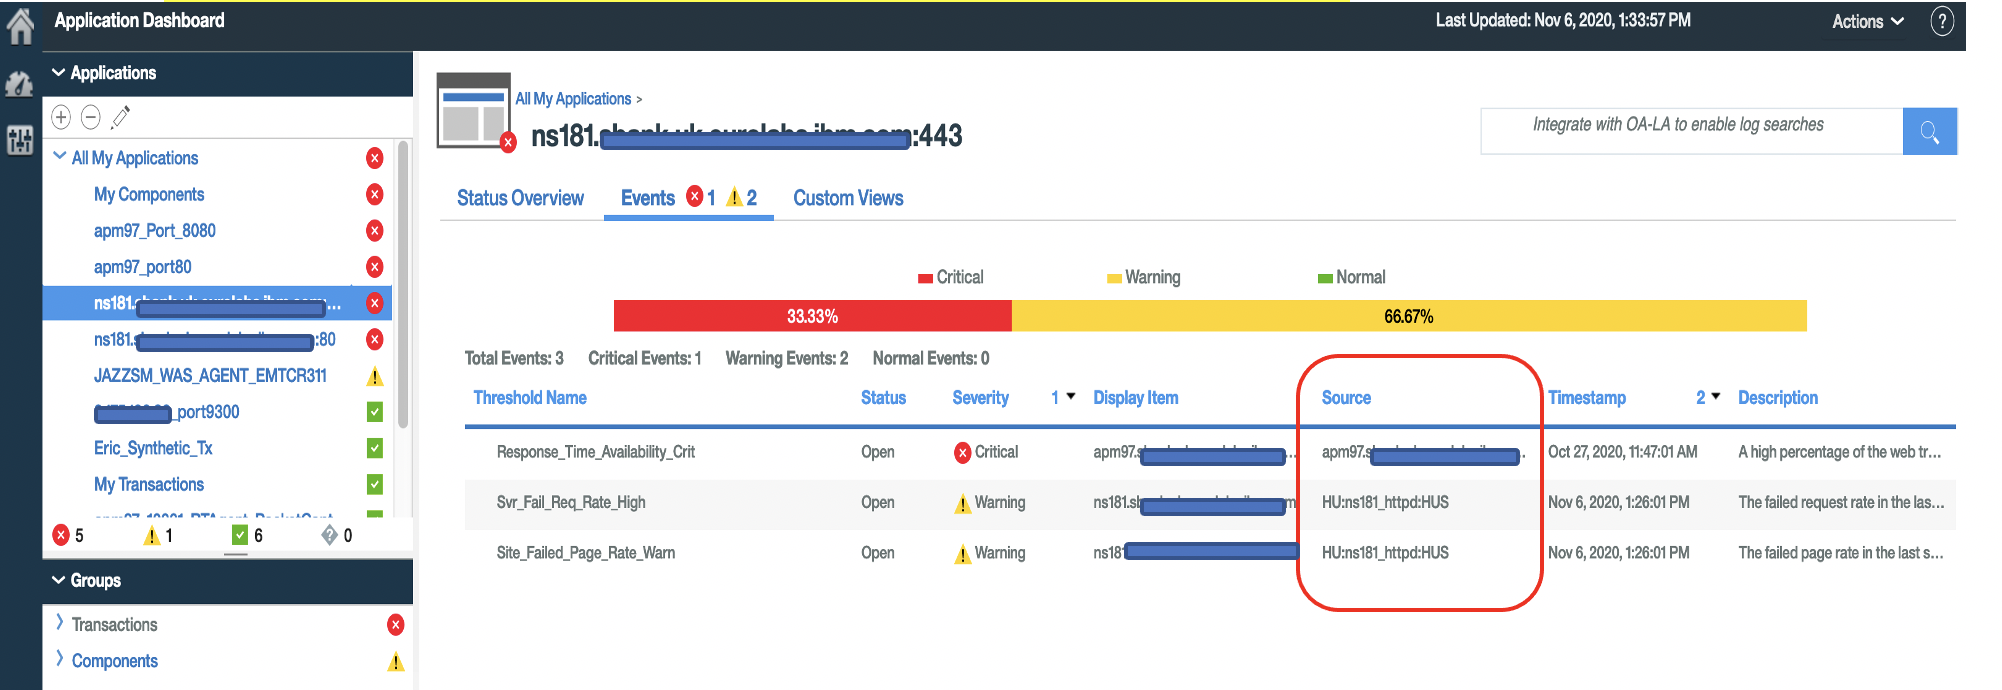
I added again the :LZ agent as source of the application (just to show the issue occurring again).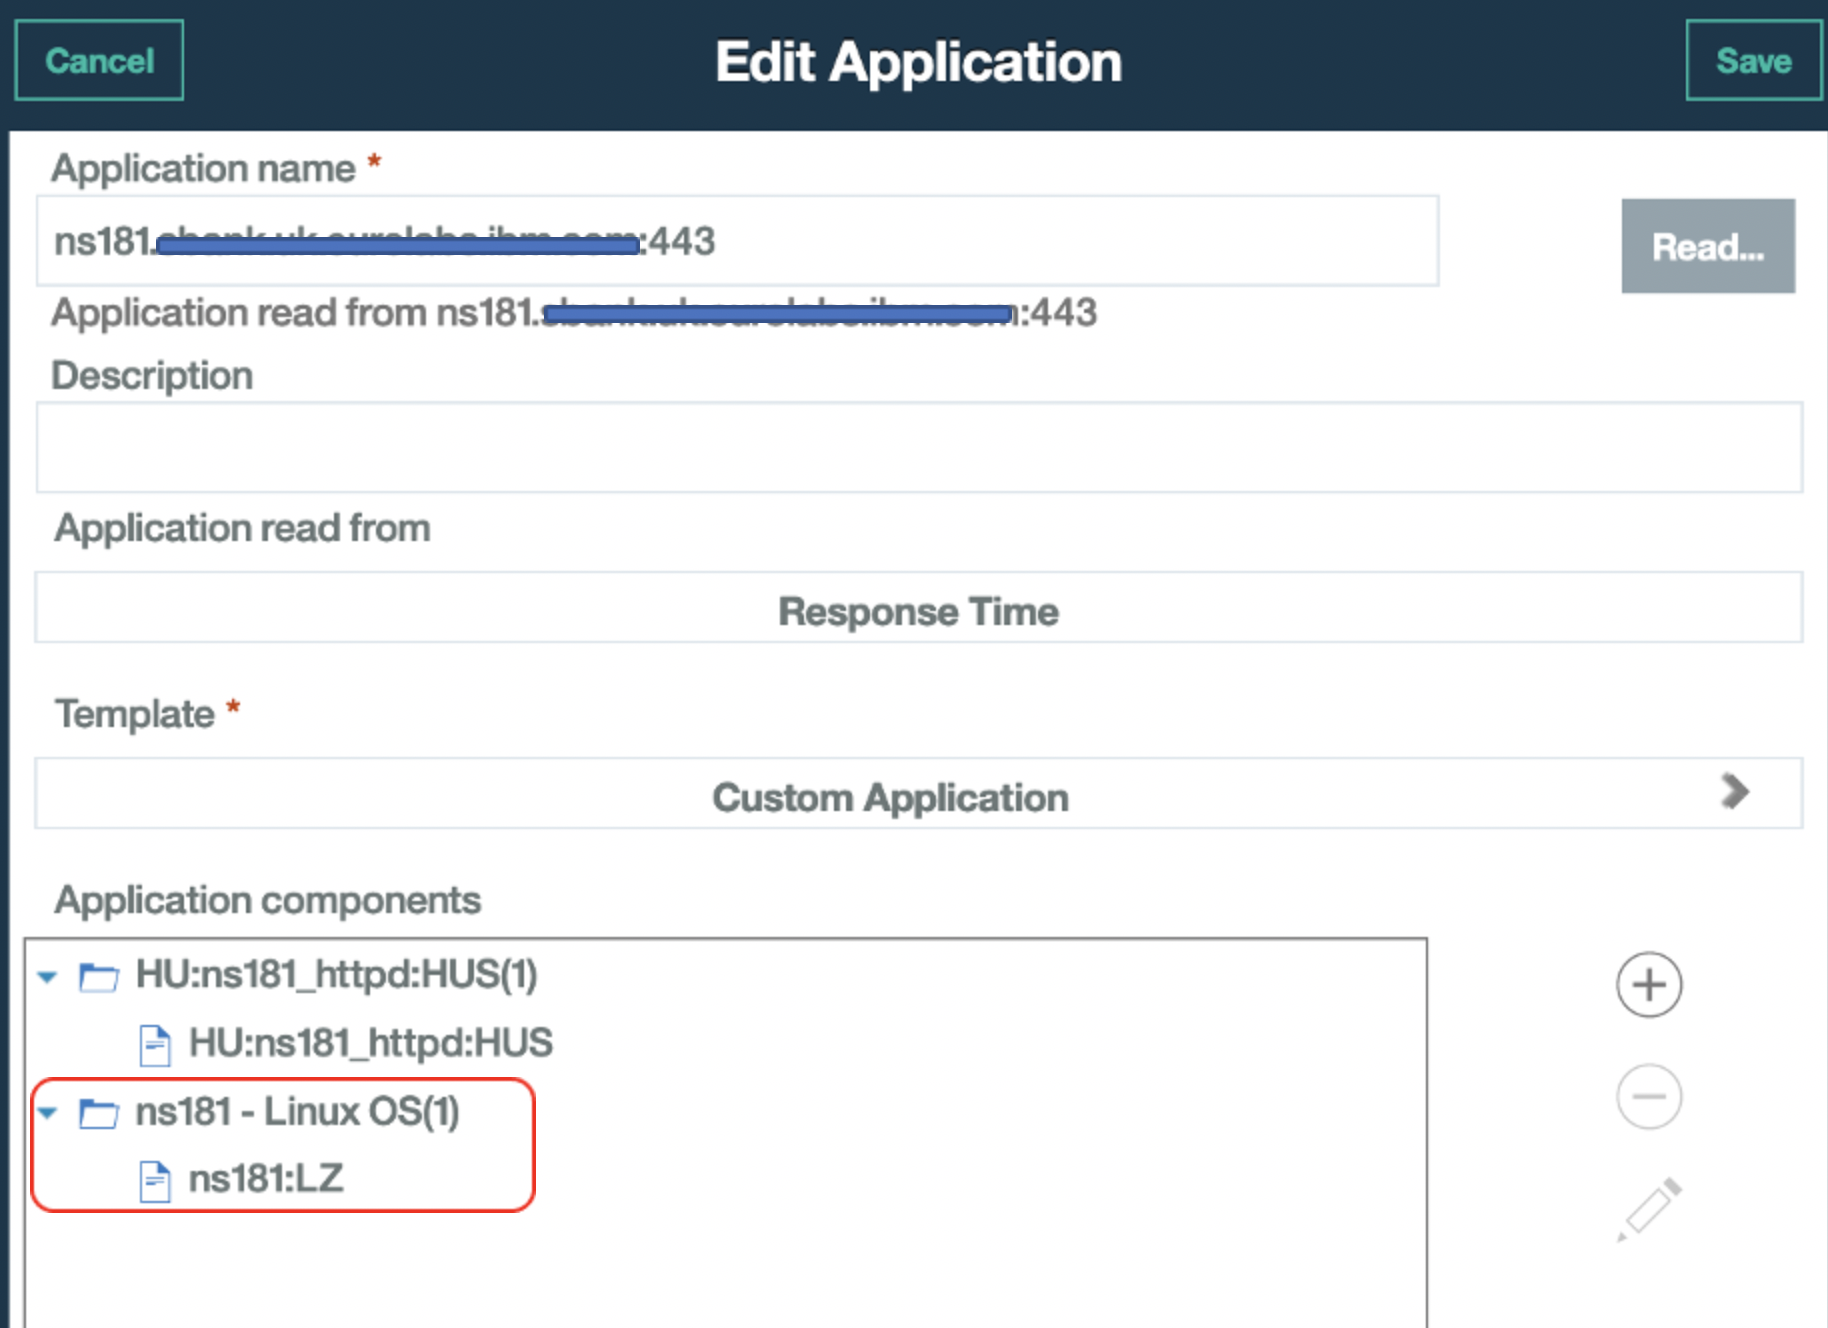
Events view:
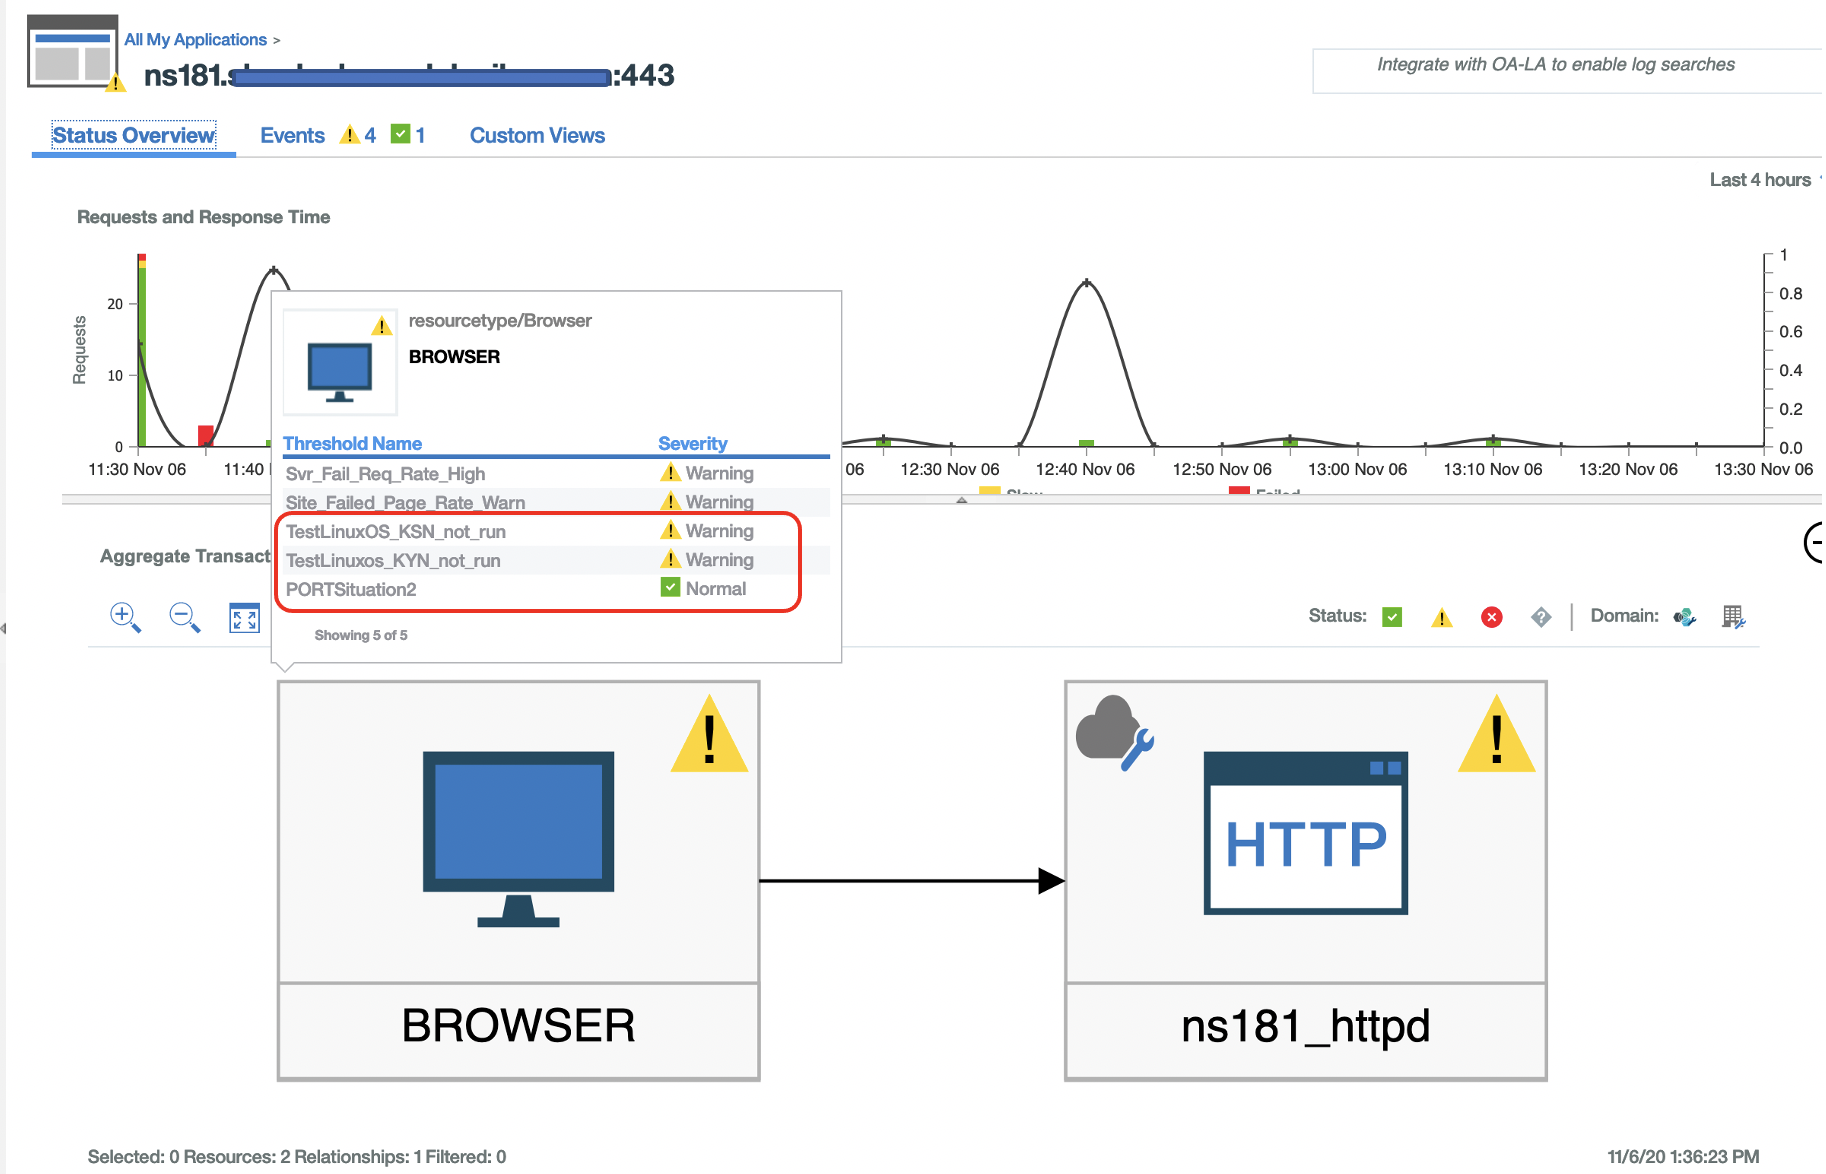
Aggregate Transaction Topology view:
Product Synonym
apm;
Was this topic helpful?
Document Information
Modified date:
27 July 2021
UID
ibm16361671