Troubleshooting
Problem
What to check when your Cisco® Identity Services Engine® Log Source that uses the UDP Multiline Syslog protocol does not work as expected.
Cause
The UDP Multiline Syslog protocol works by checking the events payloads to match the regex configured in the Message ID Pattern field, and those events payloads with the same match are combined and ingested as one.
Resolving The Problem
When you configure a Cisco® Identity Services Engine Log Source, two common problems can occur:
- Events do not reach the Console.
- Events reach the Console, but they are not being merged as one, and they are displayed as individual events.
When either of these two problems occurs, check the next steps:
- Make sure your Log Source is fully deployed:
- Click the Admin tab.
- Click the Log Source Management app.
- Manually configure a Cisco Identity Services Engine Log Source.
Note:- Cisco Identity Services Engine Log Source is not auto-discovered.
- Deploy Changes might result in services being restarted. While services are restarting, event processing stops until services restart. Scheduled reports that are in-progress need to be manually restarted by users. Administrators with strict outage policies are advised to complete the next step during a scheduled maintenance window for their organization.
- Click Deploy Changes.
- Make sure that events are displayed in the Console:
If you do not see the events in the Console, you need to confirm those events are reaching the Event Collector. The best way to address events not displayed in the Console is to run a tcpdump session on the Event Collector. Verify that the events are being received by using the Log Source IP address and port.- Use an SSH session to log in to the Console.
- From the Console, SSH to the appliance receiving the events.
- Run the tcpdump command:
tcpdump -i any src host x.x.x.x and port 517
Note: Replace x.x.x.x with the IP address of the Log Source sending the events. If you are not using the default port 517, then replace the port with the one you are using. -
If you see events reaching the Event Collector when you run the tcpdump command, validate if the events you are receiving started with the following format:
<181>Aug 9 07:36:33 cisco.ise.test CISE_Failed_Attempts 0038700411 -
Use the number after CISE_Failed_Attempts. From the example, use 0038700411
-
Log in to the QRadar® Console,
-
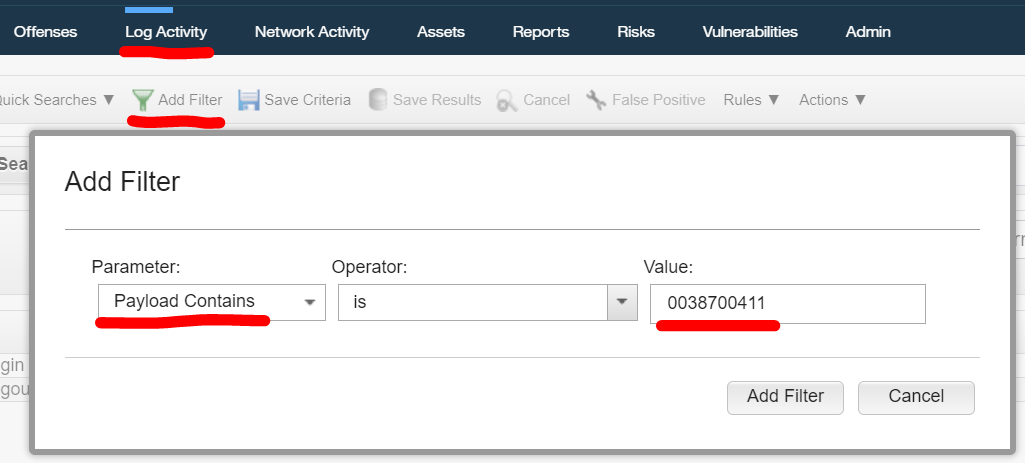
Click Log Activity > Add Filter.
-
Do a search for this event. The parameter Payload contains as follows:
-
Use the value from the example, 0038700411
-
Confirm in Log Activity that the events are displayed under the correct Log Source. It is always advisable to filter on the Log Source Identifier parameter or the source IP address and not the hostname to make sure that these events contain the wanted Log Source.
Results
If you do not see events when you run the tcpdump command, check with your networking team or the Cisco device administrator as to why these events are not arriving at the event collect. It could be a firewall blocking the connection, or the configuration on the source side is not the correct one.
-
Event not being merged:
If your events are ingested individually, check each of the next three behaviors to know the correct steps you need to follow:-
Is the Cisco Identity Services Engine sending multiline events?
-
Use an SSH session to log in to the Console as the root user.
-
SSH to the Target Event Collector where the Log Source is sending its Events.
-
Run the tcpdump command:
tcpdump -i any src host x.x.x.x and port 517
Note: You need to replace the IP address x.x.x.x with the IP address of the Cisco Log Source that is sending the events. If you are not using the default port 517, then you need to replace the port. -
Confirm you see multiple events with the same ID, for example:

-
These numbers after CISE_Failed_Attempts is the ID that QRadar uses.
-
If you are receiving many events or these are being displayed too fast, you can also redirect the tcpdump into a file that you can check with more detail to review:
tcpdump -i any src host 10.10.10.1 and port 517 >> logs.txt -
If you do not see events with the same ID, then check the Cisco Log Source configuration as it is sending only the first part of the event.
-
-
Is the regex that you are using in the log source configuration OK?
If you see events with the same ID, but the events are not merged, confirm the regex Message ID Pattern field in the Log Source configuration. The default regex is CISE_\S+ (\d{10}), and usually, you do not need to change anything. Add it as it is.
Note: Confirm that the payload of the events matches the default regex CISE_\S+ (\d{10}) by using the QRadar regex tester. -
Are the events sent to the right EC?
-
Log in to the QRadar Console.
-
Click Log Activity.
-
Click Add Filter > Log Source> = > Select the CISE Log Source. Verify whether you are able to see events.
-
Confirm that there are multiple events with the same ID as, for example, CISE_Failed_Attempts 0038700411.
-
Check the Raw Events option by modifying the Display parameter in Log Activity as follows:

-
The display shows the events with a new column named Payload where you can see the events and confirm multiple events with the same ID. If yes, confirm you configured the right Target Event Collector.
Results
If your events are sent to a different Event Collector than the one picked on the Target Event Collector in the Log Source configuration, they are displayed under the Log Source. You can confirm by using the tcpdump command mentioned in the article. If these events are being sent to a different Event Collector, you need to modify the Log Source configuration and put the correct Event Collector in the Target Event Collector field.
-
-
Related Information
Document Location
Worldwide
[{"Line of Business":{"code":"LOB24","label":"Security Software"},"Business Unit":{"code":"BU059","label":"IBM Software w\/o TPS"},"Product":{"code":"SSBQAC","label":"IBM Security QRadar SIEM"},"ARM Category":[{"code":"a8m0z000000cwt0AAA","label":"Log Source"}],"ARM Case Number":"TS004114895","Platform":[{"code":"PF025","label":"Platform Independent"}],"Version":"All Version(s)"}]
Was this topic helpful?
Document Information
Modified date:
28 December 2020
UID
ibm16326057