Release Notes
Abstract
Conventional organizations address security and compliance through a device centric approach; a device is either in or out of compliance. This device centric point of view limits the administrator’s visibility into risky behavior and patterns that exist within the organization. With most employees that use a variety of device throughout their workday, IT Administrators need a holistic view of the risk that is associated with each user. This need calls out for a feature that takes into account all of their devices and the corporate data they have accessed. With user risk management, we assign a risk score to a user based on the activities that are performed across all the user’s devices.
Administrators can view the risk in the organization by using the security dashboard. The security dashboard gives an overview of the risky users, risky devices, total risk incidents and the average risk score existing in the organization. Administrators can drill-down to the risky users and devices and get a comprehensive overview of the incidents committed by a single user with the user summary page. With the risk rule editor, Administrators can customize the risk model to identify the risk incidents according to their organization's needs.
Content
Advantages of user risk management
Following are the advantages that you get with user risk management.
- User centric view of the organization’s security posture.
- Give your own definition of risk by customizing the risk score model.
- Analytics and dashboard to view risk profile trends across organization and generate insights that helps Administrators to improve security and compliance status.
Key terms in user risk management
- Risk rules – Conditions that identify the risk incidents. Example: " Jail broken or Rooted State = True " is a risk rule that when satisfied leads to a risk incident. Administrators can view the risk rules in the Risk Rule Configurator.
- Risk incident – An event that is referred as risky since the event satisfies the conditions that are associated to a risk rule.
- Risk incident states:
- Active state – The condition that is defined in the risk rule still exists on the device.
- Resolved state – The condition defined in the risk rule has been rectified.
- Incident severity – Every risk rule and hence every risk incident is associated with a severity. Currently, there are 3 levels of severity: High, Medium, and Low.
- Risk score – Quantifies the risk that is associated with an incident. Currently, we show risk scores for users and devices. Higher the severity level of the incident, higher is the risk score.
- User risk score – Sum of risk scores across the user’s devices.
- Risky user – Users having non-zero risk score.
- Risky device – Devices having non-zero risk score.
- Decay – The rate at which the impact of a risk incident on the risk score that gradually reduces over time.
- Retention period – The maximum number of days the risk incident are retained for evaluating the risk score.
Risk Rule Configurator
You can view all the rules that identify the risk incidents in the user risk management. Each rule identifies a condition for a risk incident. When the defined condition in the risk rule is satisfied, a corresponding risk incident with a severity and score is generated against the device and the user to which the device belongs to.
Example: Suppose the rule for Application compliance state is defined in the Risk Rule Configurator with severity High and precondition is if app compliance state on device is out of compliance. In this case, if any device is out of compliance, then the precondition for the app compliance state is true and a risk incident with high severity is created against the device and the user to which the device belongs to.
To access Risk Rule Configurator in the MaaS360 portal, click Security > Risk Rule Configurator under the Security Management section.
User risk score – The risk score across all devices that a user owns is called the user risk score. When the device risk score increases then the corresponding user risk score increases as well.
Viewing the Risk Rule Configurator screen
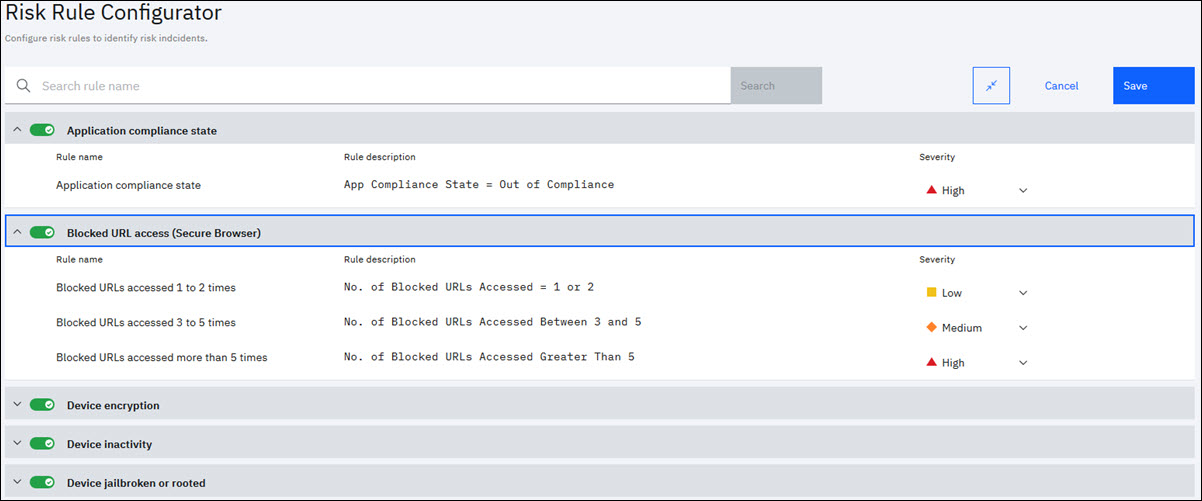
Following are the 14 predefined risk rules that are supported that is used to identify the risk score of devices and users.
- Application Compliance State- This rule is based on device application compliance status. The application compliance status becomes out of compliance when the restricted app is detected on the user device or when the required app is found missing on the user device. Use the Application Compliance settings in the respective device platform MDM policies to define the restricted apps and required apps on the device.
- Blocked URL Access (Secure Browser)- The rule checks the number of times blocked (blocklisted) URL's are accessed on the user device via the Secure Browser. Define the blocklisted URL's in the Browser > URL Filtering in the Workplace Persona policy settings.
- Device Encryption-The rule is based on the encryption status of the device. The rule checks whether the device is partially encrypted or not encrypted on all enrolled and activated devices. If the encryption status is partially encrypted, then the default severity is Medium and if the encryption status is not encrypted, then the default severity is High. There is no pre-requisite condition occurrence to detect this risk.
- Device Inactivity-The rule checks when the device was last reported to MaaS360. The duration since last reported determines the risk level of the device. The higher the number of days since it was last reported, the higher is the risk level. There is no pre-requisite condition occurrence to detect this risk.
- Device is having older version of OS which may have security vulnerability-The rule checks how old the OS version on the device is compared to the current available OS version. The higher the older version of OS on the device compared to the available OS version, the higher is the risk level. The rule is applicable on Android, iOS, macOS, and Windows 10 devices. Following are the OS version that is considered in risk rule to compare OS version on the devices: Android 11.0, iOS 13.6, macOS 10.15.6, and Windows 10.0.18363.
- Device jail-broken or rooted-The rule checks if the device is jail-broken (iOS) or rooted (Android). The status is determined for all enrolled and activated devices. Note: There is no pre-requisite condition occurrence to detect this risk.
- Device passcode not compliant- The rule checks if the passcode status on the device is compliant according to the defined passcode requirements. The passcode requirement can be defined in the MDM policies under Passcode settings. Note: There is no pre-requisite condition occurrence to detect this risk.
- Devices not managed- The rule checks for device managed status. If the device managed status is not in enrolled state, then, the risk increases for such devices.
- Malware detected- The rule is based on Trusteer Malware Status. If Trusteer Malware Status is true, the risk incident occurs. You can define the Trusteer threat management policies in Enable the Trusteer Threat Management for MDM policies.
- Mobile data usage limit exceeded- The rule checks whether network data usage limit is exceeded or if the roaming data usage limit is exceeded. This limit is considered according to the mobile plan that is defined in the Expense > Manage Plans. The Mobile Expense Management in the Services page must be enabled for the rule check to work as intended.
- Older version of MaaS360 app- The rule is based on how old the MaaS360 app version on the device (iOS and Android) is compared to the current available MaaS app version. This rule check is applicable on all enrolled and activated devices that have MaaS360 app installed.
For an Android MaaS app, the MaaS app version on the Android device is compared to version 6.90, 6.80, and whether equal or older than 6.70 versions. Similarly, for an iOS MaaS app, the MaaS app version on the iOS device is compared to version 3.97, 3.96 and whether equal or older than 3.95 versions.
- Out of compliance (OOC) events-The rule checks for the number of times the device goes out of compliance. The rule checks against the compliance rules that are defined under Security > Compliance Rules section. The higher the frequency of out of compliance events, higher is the risk score and severity. You can define the severity of this event based on the number of times the device is OOC such as 1-2 times, 3-5 times, and more than 5 times.
- SIM change detected on device-This rule checks if any SIM card change action has occurred on the device. If any SIM change is detected on the device, then by default Medium severity is applied. Note: There is no pre-requisite condition occurrence to detect this risk. The sim change rule is applicable only on devices having ownership as "Corporate Owned" or "Corporate Third Party".
-
Usage policy acceptance- The rule is based on the usage policy acceptance status on the device. You can define the severity for rule based on usage policy acceptance status (expired, not accepted, pending). If the defined usage policy is expired on the device, then the status is set to expired. Similarly, if the usage policy is not accepted on the device, status is not accepted. If usage policy acceptance is pending on the device, then the status is pending. Define the Usage acceptance policy under Workplace Persona Policy. Note: The EULA Management Service in the Services page must be enabled for the rule check to work as intended.
Administrator actions in the Risk Rule Configurator
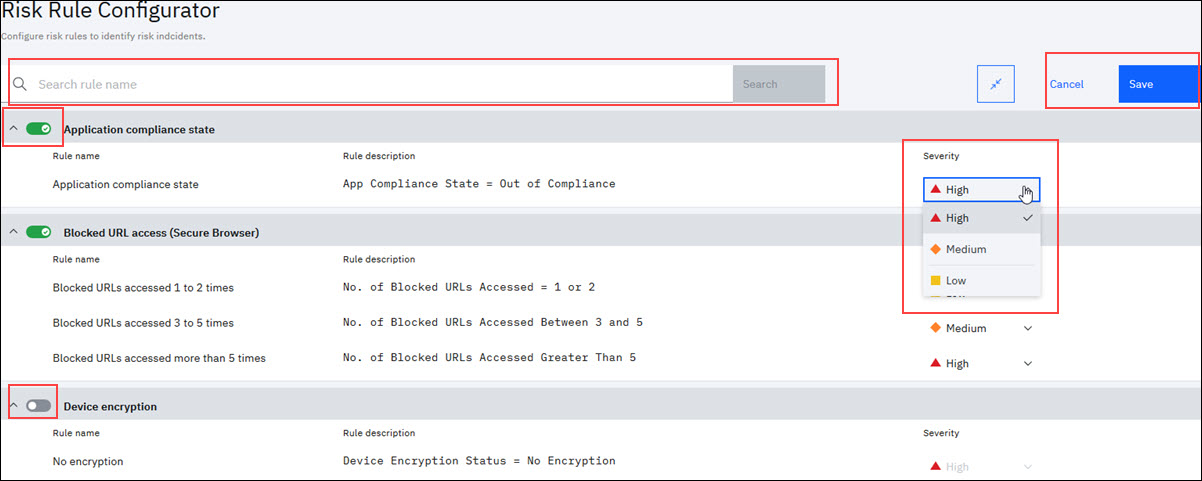
In the Risk Rule Configurator, Administrator gets to enable or disable a risk rule for the organization from the predefined risk rules. By default, every risk rule is enabled and a severity is associated to each of the risk rule.
On enabling a rule name, you can also assign the severity of an incident for a risk rule such as Low, Medium, High. Based on this severity, the risk scores are assigned to devices and users when the risk is detected on the user device. Click Save to save and apply the risk rules configuration to the organization risk security monitoring.
Administrator can also search for a particular risk in the Risk Rule Configurator by using the Search option.
Viewing the Risk Rule Configurator screen
Security Dashboard
Following are the aggregated metrics that Administrator gets to view in the Security Dashboard.
Average risk score – The sum of user risk scores of all the users that is divided by the number of users who have at least one device is called the average risk score of your organization.
Example: There are 5 users with user risk score as 105, 35, 90, 75, and 80 and each of these users have at least one device. There are total of 10 users in the organization with at least one device. In this case, the average risk score is sum of all the user risk scores that is divided by total number of users with at least one device. The average risk score is 38.5. The dashboard displays the score as 39 and hover over the average risk score value to view the exact score of 38.5 in the tool-tip.
Risky users – Any user with a non-zero risk score is a risky user. For each incident, there is a risk score associated. A user can have more than one incident. Each incident contributes to the total risk score of the user.
Example: There are total of 10 users in the organization. Out of 10 users, 6 users have a risk score associated and 4 users risk score is zero. In this case, the risky users count is 6.
Risky devices – Any device with a non-zero risk score is referred as a risky device.
Risk incidents – An event that satisfies the condition that is given in the risk rules is a risk incident. Each risk incident has a severity and risk score that is associated with it. The Risky Incidents metric on the Security Dashboard is the total number of risky incidents contributing to the risk score that includes both active and resolved incidents. Note: Once the risk incident is resolved, the risk score does not drop to zero instantly. The risk score that is associated with the incident decreases gradually every day until the risk score reaches 0. Unless the risk score associated with the incident reaches 0, the risk incident is counted in all the metrics.
Viewing an example of Security Dashboard
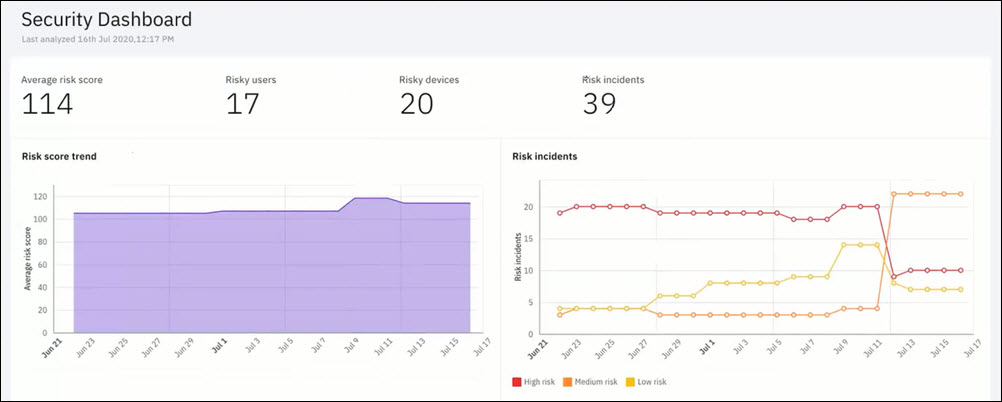
- The example Security Dashboard that is shown in this image is interpreted as follows.
- The organization has an average risk score of 114. This average is the sum of all user's risk score that is divided by the total number of users in the organization that has at least one device.
- The number of users with a non-zero risk score is 17.
- There are 20 devices that have a non-zero risk score. The number of users (17) is less than the number of devices (20) as a user might have more than one device.
- There are total of 39 risk incidents in the organization. This count includes both open and resolved risk incidents that are contributing to the user's risk score.
- Average risk score trend shows how the risk score has changed in the last 60 days.
- Risk incidents widget shows the number of incidents that were contributing to the users' risk score on each day for the past 60 days.
- Risk score trend and risk incidents are some of the risk score and risk incidents statistics that you see in the Security Dashboard.
Incident Decay
The risk incidents are created when any of the preconditions for the enabled risk rules in the Risk Rule Configurator is detected on the user device. Based on the severity (low, medium, high) of the risk incident, the risk scores are added. The risk incident gets resolved when the contribution of this incident to the risk score is zero.
Consider a risk incident associated with the Application Compliance State risk rule. When the user installs a restricted app or does not have a required app installed as true, the application compliance status becomes out of compliance. The risk incident that is associated with the Application Compliance state will be Active.
When the user uninstalls the restricted app or installs the required app, the application compliance state becomes in compliance. The risk incident that is associated with this rule becomes Resolved. However, the risk score contribution by this incident will not become 0 immediately. The risk score that is associated with this event decrease gradually and become zero in a period of 7-10 days.
Risk rules such as Blocked URL access, SIM swap, and out of compliance events are considered as user behavior related risks as they are based on the frequency of occurrence of these events. For these rules, a risk incident is considered resolved when the risk engine does not detect the events in the past 24 hours. The risk score that is associated with these events decrease gradually and become zero in a period of 7-10 days. The graph depicts the average risk score vs the day in a month.
Security Dashboard reporting widgets
- Risk score trend
- Risk incidents
- Users with risk incidents
- Top risk incidents
- Top risky users
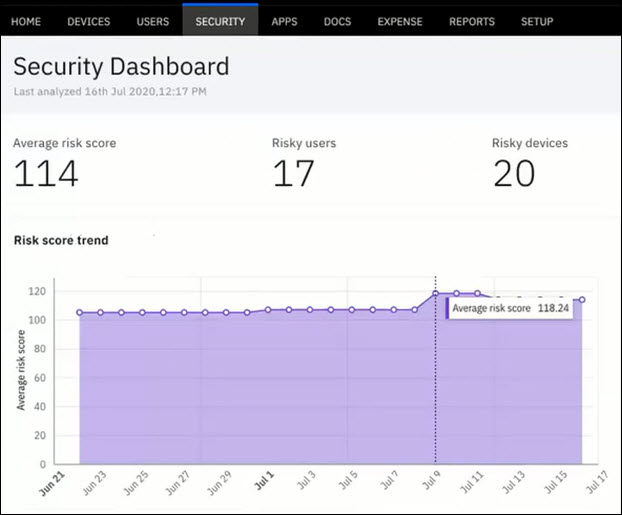
Risk score trend
Viewing an example of risk score trend
In this example risk score trend graph, the average risk score for July 9 is 118.24. Likewise, you can hover over the graph to view the average score for any date from start date (June 21) to the current date July 17. The graph is usually displayed considering days in the span for 2 months.
Risk incidents
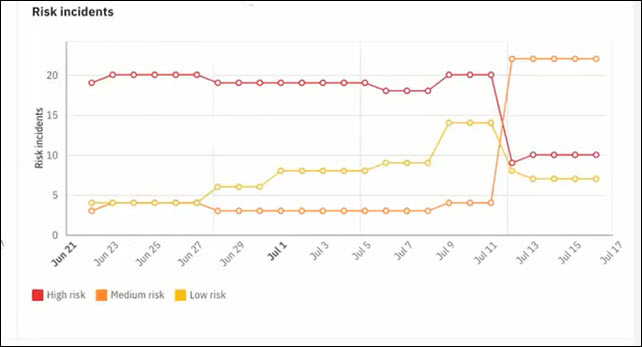
The Risk incidents report trend shows the total number of risk incidents that contributes to the users' risk score on a given day. This data includes both the active and resolved risk incidents. Only when a risk incident's contribution to the risk score becomes zero (Incident Decay), the risk incident is removed from the risk incidents count.
Viewing an example of risk incidents graph
In this example risk incidents, the graph shows the risk incidents trends for high risk, medium risk, and low risk for all dates from June 21 to July 17. The high risks are shown in red line, medium risk in orange line, and low risk in yellow line. Hover over the graph to view the count of high, medium, and low risk incidents for any day.
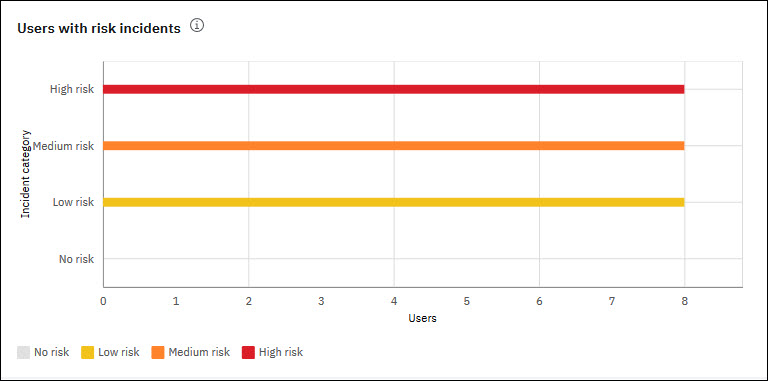
Viewing the Users with risk incidents graph
The graph depicts the risk category vs the Users in the organization who have risk incidents. In this graph, there are a total 8 users who have risk incidents. There are 8 users who have high, medium, and risk incidents. There are no users with no risk incidents. For detailed view of users with risk incidents, refer Risky Users security dashboard. Click the user name in the Risk Users dashboard to view the user Summary View and more details on risk incidents for that specific user.
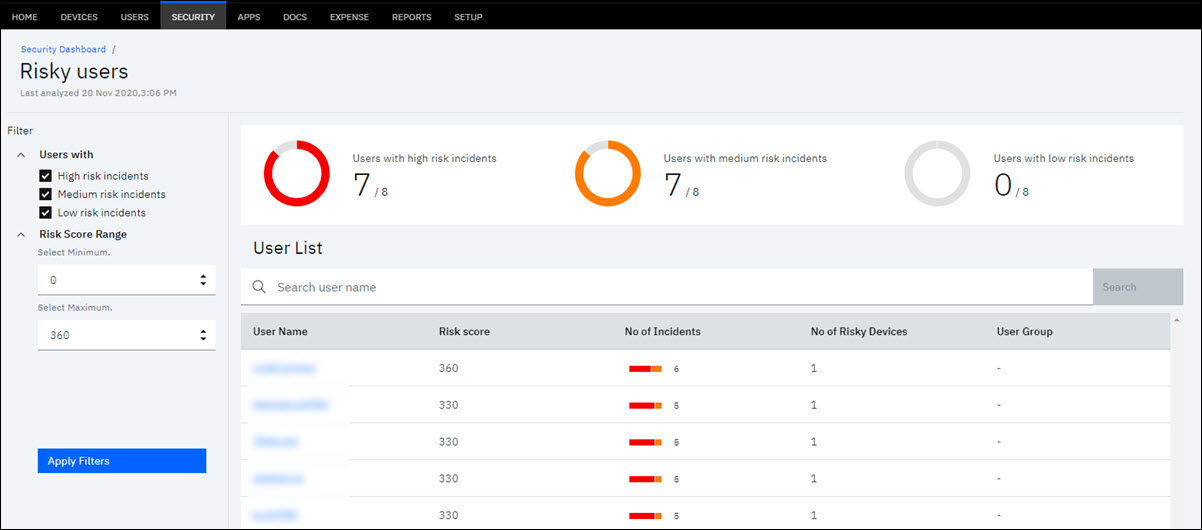
Expanded view of the users with risk incidents
On the click of the graph line corresponding to any of the risk categories, you are navigated to the Risky Users security dashboard. This dashboard gives an expanded view of the users with high risk, medium risk, and low risk incidents.
Following details and actions can be performed in the Risky Users security dashboard.
- The top of the dashboard, you see the count of users with high risk incidents, medium risk incidents, and low risk incidents vs the total number of users in the organization.
- By default, the dashboard displays all user names with risk incidents under all of the risk category.
- Use the search option at the User List to filter users by user name. In this case, only the risk associated for the searched user is displayed.
- Use the Filter option to view users with high risk, medium risk, and low risk incidents. You can also specify the minimum and maximum risk score range to view users that have risk incidents within the risk score range. Click Apply Filters to save and apply the filter options that you selected. Both the user list data and the chart dashboard is updated according to the filters that are applied.
- At any time, you can use Reset Filters to default or edit filters to view the users with risk incidents under any of the risk category and risk score range.
- Based on the filters selection, the user details contributing to the specified risk category or risk score range is displayed. The user details include the following.
- User Name – Lists all user names who have risk incidents in a selected risk category.
- Risk Sore: Shows each user's risk score.
- No of Incidents – The number of risk incidents for a user is displayed. All incidents under that user that belongs to any risk incident category is displayed here.
- No. of Risky Devices – A user can have one or more devices. The count of all devices for that user, which are responsible for the user's risk incidents is displayed here.
- User Group – Displays the user group name if the user belongs to any user groups in the organization.
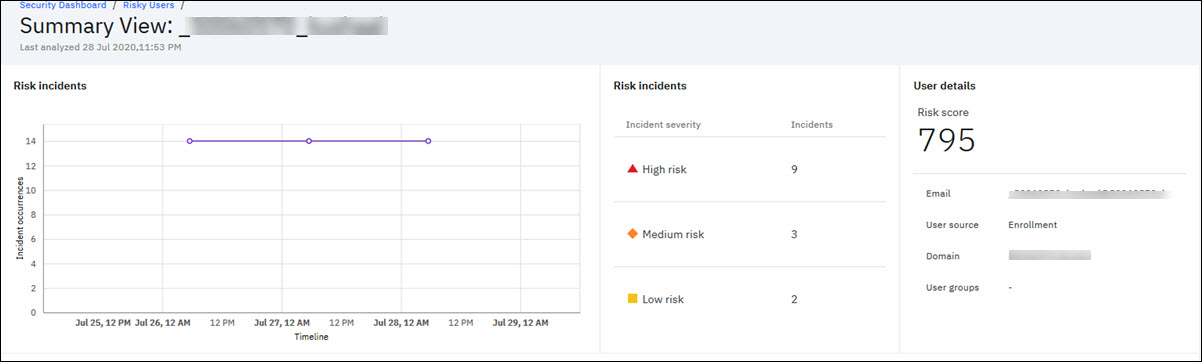
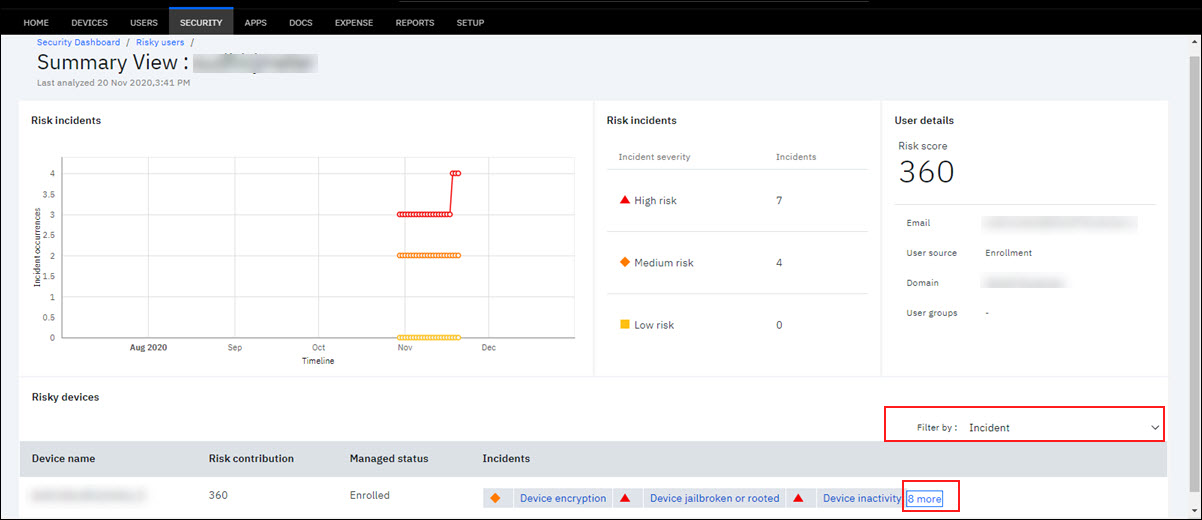
From the Risk Users dashboard, click the corresponding user name to view more details on user summary for risk incidents. The Summary View includes following details.
- Risk incidents and User details – This section includes the graph view and count of incidents under each incident severity. The graph shows the timeline of the incident occurrence. Every time the risk engine executes, the incident occurrence and the timeline is updated. The risk incident also shows the number of high risk, medium risk, and low risk incidents that are present for the user account. The user details show the risk score of the user, user email address, user source, domain, and user group to which the user belongs to.
Viewing an example of summary view for risky users
- Risky devices – This section lists all devices for that user that are causing the risk incidents and contributing the user risk score. The user might have one or more devices. All the devices with risk incidents for the user account is displayed here.
Viewing an example of summary view for risky users
Viewing an example of risky devices list for a user with a bell icon
![]()
Following details are shown for every risk device of a user.
- Device name – The user device that has risk incident. Note: A device can have more than one risk incident.
- Risk contribution – The total sum of risk score contribution that the device is responsible for is displayed here. All risk incidents for that device are considered to calculate the total risk score.
- Managed status – Shows whether the device is in enrolled or not enrolled status in the organization.
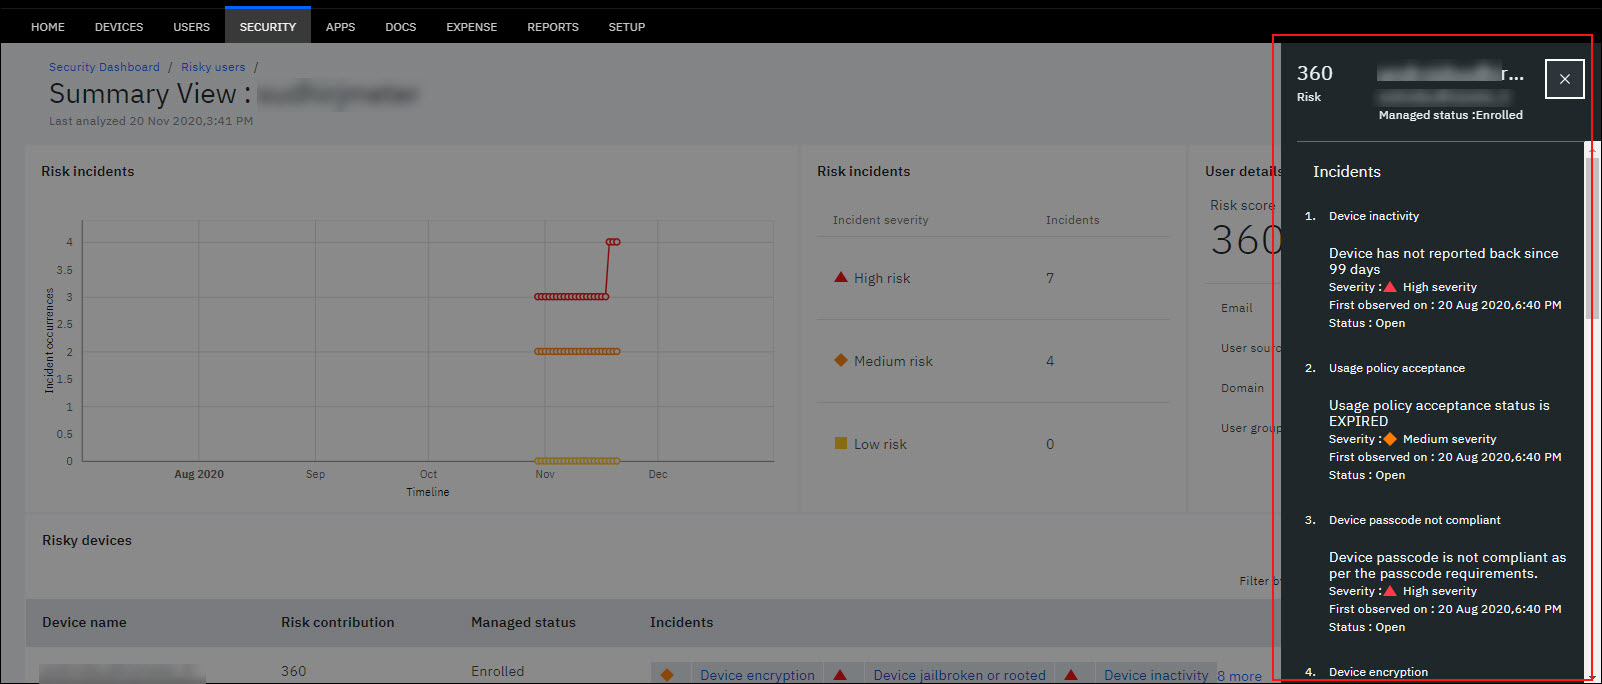
- Incidents – All the risk incidents for that device is displayed. All the incidents that occurred on the device contributes to the risk score. Click the incidents to get detailed view of incident occurrence cause, severity, when the incident was first observed on, and incident status as open or resolved.
- Use the Filter by option to filter the incidents by the risk rules. On applying a filter, you see only incidents on the device for the risk rules that are selected in the filter option.
- A bell icon is displayed at the right-end corner that allows to send notification to the user that the user device is identified as risky and the reasons for identifying the device as risky. Note: This option is available only if the device managed status is 'enrolled' or 'activated'.
- Click the more option at the right-end corner of the table data to see the detailed view of all incidents for a user device. Note: The more option displays along with the count of risk incidents that are associated with this user device.
Viewing the detailed view of incidents for a user device
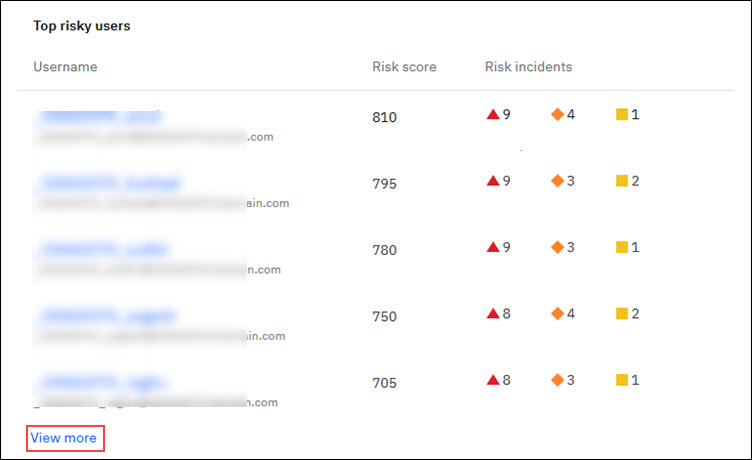
Top risky users
The Top Risky Users report shows the top users with highest risk scores. The users with highest risk scores are ranked first and in decreasing order of the risk score, the users are ranked. In the Security Dashboard, you see the top 5 risky users listed. On the click of View more, you are navigated to the Risky Users dashboard. In this dashboard, Administrator can view all the risky users who are ranked in the decreasing order of their risk scores.
The Top risky users statistics shows the risk scores and the corresponding incidents that are contributing to the risk score. For a user, you also get to see the number of risk incidents that are present under each risk category type.
Viewing the top risky users statistics
Top risk incidents
The risk incident that is encountered in most number of devices in the organization is refereed as the top risk incident. In the decreasing order of most devices impacted by risk incidents, the top risk incidents are ordered.
In the Security Dashboard, the top risk incidents statistics shows the incident type, risk incidents, and count of affected devices.
Viewing the top risky incidents statistics
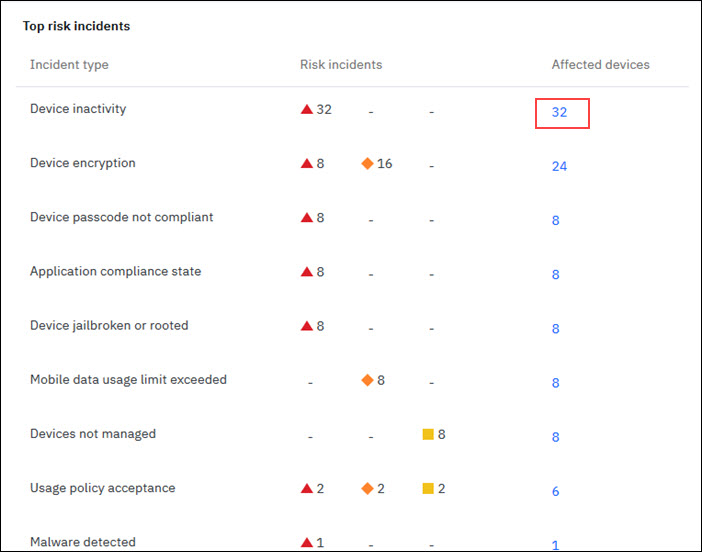
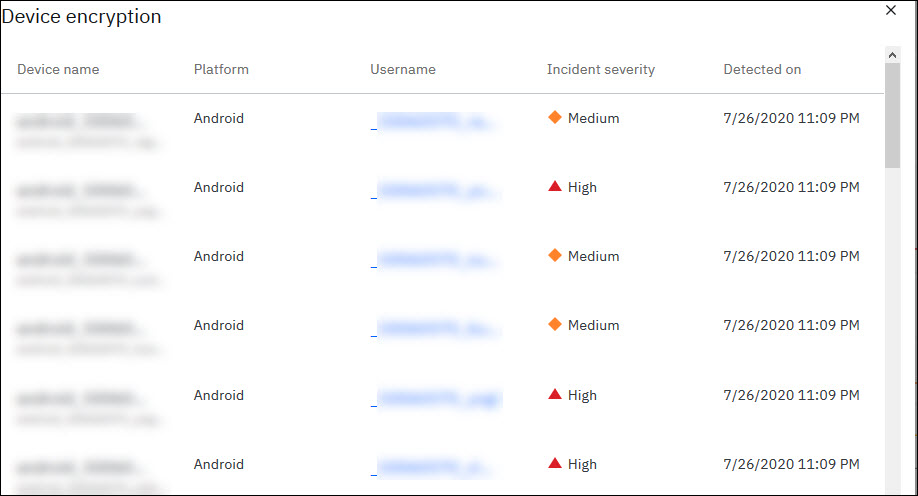
On the click of affected devices count, the detailed summary of devices that are impacted for an incident type is listed. The details include device names (with device ID), device platform, user who owns the device, the incident severity, and time when the incident was detected.
Note: To uniquely identify the device with top risk incident, use the device ID that is listed in the Device name column. Copy the device ID, go to Device Inventory, and search the device by device ID attribute.
Viewing the detailed summary of devices impacted by a device encryption – top risk incident
Localization support
Frequently Asked Questions
Does user risk management impact existing MaaS workflows, policies, compliance rules, and so on?
The user risk management is an Analytics feature that works on top of the existing MaaS features. The feature does not impact or replace any of the existing workflows including policies, compliance rules, and others. The feature provides additional insights based on risk behaviors MaaS360 detects across all users and devices.
Does all the risk rules work for all customers?
While there are multiple risk rules that are available out of the box for all customers,. however, the risk rules work only if,
- The customer has enabled the risk rules in the risk rule configurator.
- The customer has the required feature or capability enabled in their environment. Example: The malware detection rule works only if the customer has purchased Enterprise or MTM service.
How frequently is the risk evaluated?
The risk engine runs once every 24 hours. During the run, risk engine evaluates existing incidents, new incidents, and updates the risk scores accordingly.
How does risk score change – increase or decrease?
The risk score increases when a new incident is found associated with the risk rules that are enabled. The score decreases based on two factors:
- The effect of an incident on the risk score decays over time.
- The incident is resolved.
The addition or removal of risk rules also impacts the risk score since the action leads to new incidents being discovered.
What happens to the risk score when the risk rules are added or removed?
When new risk rules are added, the subsequent evaluations consider the risk rules and detect incidents that are related to the new rules. This action might lead to new risk incidents detected and hence increases the risk scores.
When risk rules are removed, the subsequent evaluations start ignoring incidents that are related to the rules. Any existing identified risk incidents that are associated with the rule continue to show in the dashboard and continues to contribute to the user’s risk score until the retention period of the incident is complete (60 days).
What happens to the risk score when the risk rule severity is modified?
When the severity of a risk rule is changed – for example, increased from Low to Medium or High, or reduced from High to Medium or Low, the new severity takes into effect for the next run of the risk engine. The risk incidents that are detected in the subsequent risk engine runs considers the new risk severity.
What happens when the risk incident is resolved by the user?
The resolved incidents also keep contributing to the user risk score and does not become zero as soon as the incident is resolved. The impact of the resolved incident on the risk score decays over a period of time. When the risk score reaches zero, the incident is removed from the risk calculation and incident counts.
How does risk management handle inactive devices and users?
Will users see their risk scores?
The user risk management feature is dedicated only for the Administrators. The risk incidents, risk scores are visible only to the Administrator. The users do not get to see the risk score. The Security dashboard allows the Administrator to notify the user. The Administrator can choose this feature to notify the user about the risk incidents found on the user’s device.
Known Issues
| Issue | Current behavior | Desired behavior |
|---|---|---|
| Re-occurrence of risk incidents not handled correctly | When a risk incident re-occurs, it is not considered as a new event. Instead, the incident is merged with the existing risk incident and the risk scores do not change. | Every incident including re-occurrence of an incident is treated as a unique incident and the risk score increases. |
| Change in risk severity of previously identified incidents when the risk rule severity is changed | An existing risk incident that is associated with older severity gets updated to reflect the new severity only when another risk incident occurs on that device. | Any new risk incidents that occur after the change in risk rule severity indicates the new severity. Incidents before the severity change continues to have the older severity. |
| Handling corporate shared devices | Devices that are of the type corporate shared are excluded from the risk analysis and not displayed in the security dashboard as well. | The feature excludes corporate shared devices from risk analysis on an ongoing basis. |
| Handling resolved incidents | Currently, the impact of resolved incidents on the risk score always decay that means the risk score reduces over time. | Administrators can choose to exclude resolved incidents from the risk score completely instead of allowing it to decay. |
| Detailed information that is related to incidents on the user summary page | With user risk management (BETA version), the information that is related to each incident on the user summary page is limited. For more details, example: Malware name, app version, and so on. Administrators must use the Device Inventory workflow or the Advanced Search workflow. | Incident information in the risk dashboard will be enhanced to show all details associated with them. Example: malware related risk incident will show the malware name. Application compliance related incident will show the information about blocked apps or required apps. |
Was this topic helpful?
Document Information
Modified date:
30 November 2020
UID
ibm16259385