How To
Summary
Reading the Statistics.txt file isn't very intuitive for some users. Here's an example of how to break down the numbers.
Objective
This method is useful when troubleshooting Wincollect stability or you want a quick check whether the agent is working or not.
Steps
The default path for the Statistics file is in C:\Program Files\IBM\WinCollect\logs.
In general, every restart of the agent, creates a new interval in the Statistics log.
I wanted to examine an interval so I copied it from the Statistics.txt file and pasted it into a spreadsheet application.

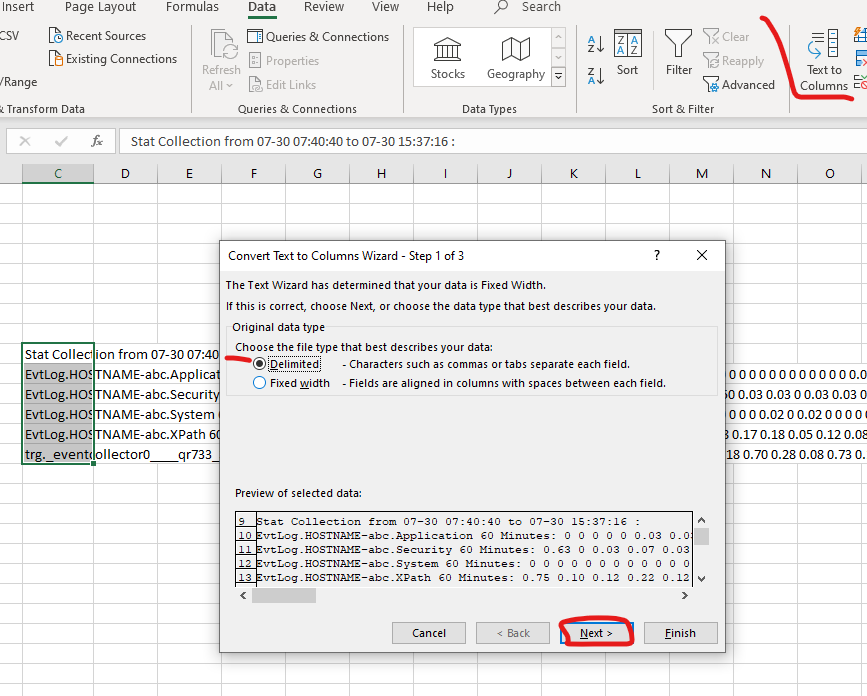
Then, I selected the rows with text and clicked on Text to Columns.
Select, Delimited Text and click on Next.

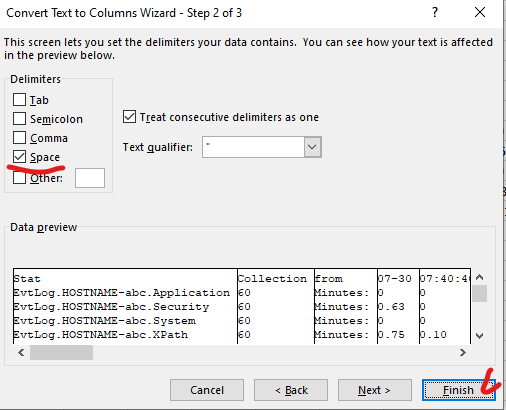
Select Space as Delimiter, and click Finish.

Result:

| EvtLog.HOSTNAME-abc.Application | This row is the EPS for the Application channel which we read from host HOSTNAME-abc |
| EvtLog.HOSTNAME-abc.Security | This row is the EPS for the Security channel which we read from host HOSTNAME-abc |
| EvtLog.HOSTNAME-abc.System | This row is the EPS for the System channel which we read from host HOSTNAME-abc |
| EvtLog.HOSTNAME-abc.XPath | This row is the EPS for the Xpath query which we read from host HOSTNAME-abc |
| trg._eventcollector0____qr733_3199____UDP | This row is the EPS that we are sending to the Target Destination named "eventcollector0____qr733_3199____UDP". This value should be very near the sum of the rows above in the same column. |
Note, if you have polling other event types as well, such as DNS, File Services, Forwarded Events etc, every log source type will have it's own row.
Same is true for Remote polled log sources - every log source type will be shown for every remotely polled host in this file.
Every log source type here is called a Channel. See also:
This makes this file useful also if you want to quickly calculate how many Channels you are polling events from.
Note the interval time on the first line. I'm making a cell reference in the column under "Minutes". Minutes basically means that every column is 1 minute from the next one.
The values for 1 minute increments are EPS. The values for 1 hour / 1 day increments are AVG EPS / MAX EPS.

Therefore, I type in as a time format: 00:01:00 to represent the 1 minute increments.
Next, I make a simple formula based on the interval end timestamp and the increment. You can see from the cell reference the increment is a static reference ($ characters).

Now I can copy the formula along the row to display the timestamps for every EPS value.


If I need to know "What was the EPS between 15:26:16 and 15:27:16 I can simply follow the timestamps to read the value.
The same method works for hours as well. I just have to use 1 hour increments (time format: 01:00:00)


For 1 day increments, you simply use the date instead of the time stamp.
This means, you can not use this method for finding out - "how much was my AVG EPS 2 days ago at noon", since for days gone, you only get a total AVG EPS / MAX EPS per day. For this question, you need to check in QRadar Log Activity using searches with appropriate filters.
Document Location
Worldwide
[{"Business Unit":{"code":"BU059","label":"IBM Software w\/o TPS"},"Product":{"code":"SSBQAC","label":"IBM Security QRadar SIEM"},"ARM Category":[{"code":"a8m0z000000cwtwAAA","label":"WinCollect"}],"ARM Case Number":"","Platform":[{"code":"PF025","label":"Platform Independent"}],"Version":"All Version(s)","Line of Business":{"code":"LOB24","label":"Security Software"}}]
Was this topic helpful?
Document Information
Modified date:
10 August 2020
UID
ibm16254762