Technical Blog Post
Abstract
Part 3 of 3: Leveraging Kibana to create custom visualizations - Search, analyze, and visualize Spark application data with IBM Spectrum Conductor
Body
![]() Kibana is a popular web-based graphical interface to visualize and navigate data within Elasticsearch.
Kibana is a popular web-based graphical interface to visualize and navigate data within Elasticsearch.
This blog demonstrates how to integrate Kibana into your IBM Spectrum Conductor cluster for data exploration and visualization based on Spark application resource metrics in IBM Spectrum Conductor. This blog also refers to a downloadable sample of how to use Kibana 5.4.2 with IBM Spectrum Conductor 2.3.
This blog is the final part of a three-part blog series:
- Part 1: Integrating with the Elastic Stack to search for data
- Part 2: Analyzing data with Explorer reports and the Spark resource usage aggregation data loader
- Part 3: Leveraging Kibana to create custom visualizations
System requirements
Before you complete the Kibana integration, ensure that the following prerequisites are met:
- You have an IBM Spectrum Conductor cluster installed and running.
- You have started the Spark resource usage aggregation data loader (called sparkresusageaggloader). Refer to the previous blog in this series (Part 2: Analyzing data with Explorer reports and its data loader for reporting) for details about this data loader. To ensure that the data loader has collected enough metrics, run the data loader for a full day.
Kibana utilizes the Elasticsearch cluster in your IBM Spectrum Conductor cluster. You may need to scale the Elasticsearch clients to meet increased querying demands; do so by increasing the maximum instances of the elk-elasticsearch-client service in the EGO Elastic Stack framework in IBM Spectrum Conductor to scale horizontally across the management nodes in your IBM Spectrum Conductor cluster.
Elasticsearch index template
Aggregated metrics, including allocated slots, cores, and memory for both CPU and GPU, are stored in Elasticsearch indices prefixed with ibm-cws-reporting-spark-metric-. Each record stores Spark instance group, user name, and top consumer information, which in turn can be used as filters or to further aggregate metrics.
This index can be used to create custom visualizations in Kibana. Refer to Part 2: Analyzing data with Explorer reports and its data loader for reporting for a detailed index template example.
Integrating Kibana with IBM Spectrum Conductor
To use Kibana to access data collected by IBM Spectrum Conductor and stored in an Elasticsearch cluster, you first need to download Kibana to connect to the Elasticsearch cluster configured in IBM Spectrum Conductor. You can get full instructions and sample script files here.
After you have integrated Kibana in IBM Spectrum Conductor, you can easily create custom visualizations or dashboards based on the aggregated Spark resource usage metrics in IBM Spectrum Conductor 2.3.
Follow the instructions in the sample script and launch a Kibana browser. The sample Kibana dashboard and visualizations are included in the sample and detailed below.
Kibana dashboard with Spark resource usage metrics
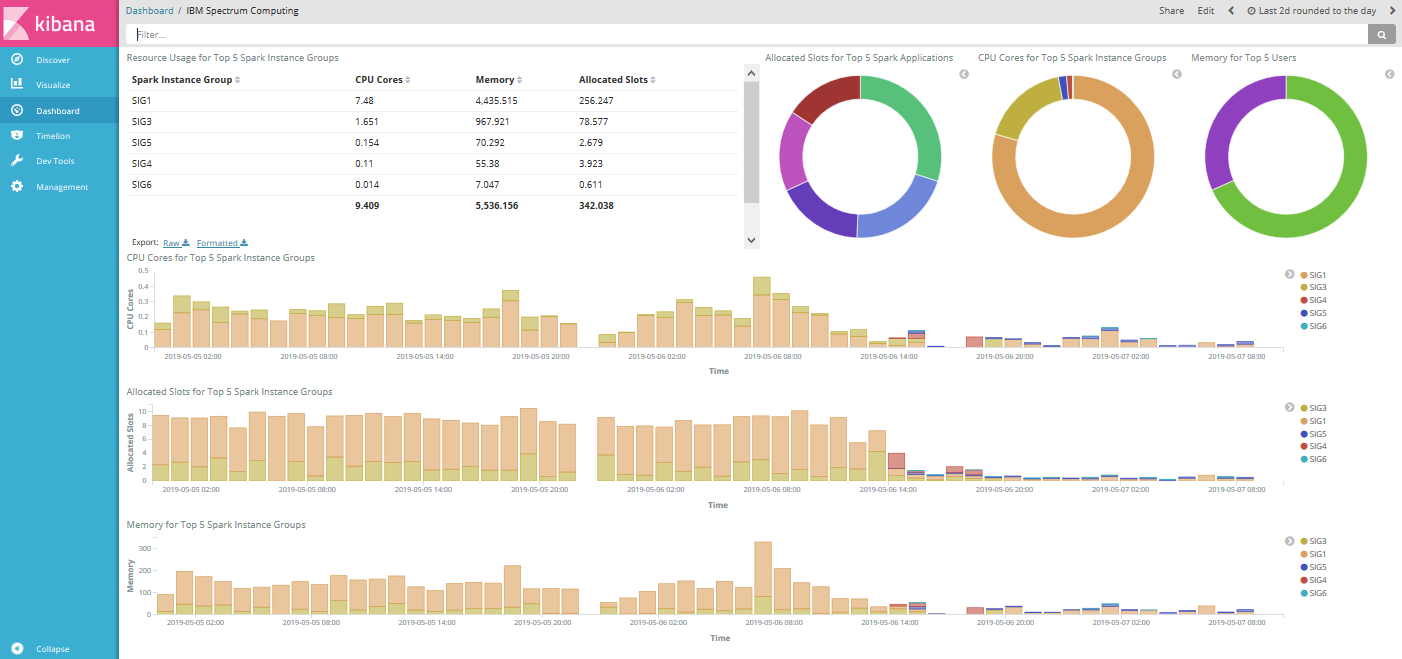
The sample includes an IBM Spectrum Conductor dashboard, to provide visualizations fed by the Spark resource usage metrics from your IBM Spectrum Conductor cluster. You can modify all visualizations, including the dashboard, to fit your business requirements.
The IBM Spectrum Conductor dashboard consists of the following visualizations (all visualizations refer to a specified time range, which is initially configured to range from two days prior to now):
- Resource Usage for Top 5 Spark Instance Groups – A data table that shows the total cores, memory, allocated slots for the top five consumers (ordered by descending CPU cores) during a specified time range. You can sort the list by toggling the up and down arrows next to the field titles, and a visualization shows a total under the table.
- Allocated Slots for Top 5 Spark Applications – A pie chart that shows the total allocated slots for the top five Spark applications (ordered by descending allocated slots) across all Spark instance groups during a specified time range.
- CPU Cores for Top 5 Spark Instance Groups – A pie chart that shows the total CPU cores for the top five Spark instance groups (ordered by descending CPU cores) across all Spark instance groups during a specified time range.
- Memory for Top 5 Users – A pie chart that shows the total memory for the top five users (ordered by descending memory) across all Spark instance groups during a specified time range.
- CPU Cores for Top 5 Spark Instance Groups – A vertical bar chart that shows the total CPU cores for the top five Spark instance groups (ordered by descending CPU cores) across all Spark instance groups during a specified time range, based on an hourly bucket of time.
- Allocated Slots for Top 5 Spark Instance Groups – A vertical bar chart that shows the total allocated slots for the top five Spark instance groups (ordered by descending allocated slots) across all Spark instance groups during a specified time range, based on an hourly bucket of time.
- Memory for Top 5 Spark Instance Groups – A vertical bar chart that shows the total memory for the top five Spark instance groups (ordered by descending memory) across all Spark instance groups during a specified time range, based on an hourly bucket of time.
You can hover over sections in the visualizations to see detailed statistics for the selected section.
You can apply filters by clicking on a section (such as a Spark instance group, application ID, user, or time range), and the filter will be applied to all visualizations in the dashboard to drill down on that specific filter. For example, in the following screen capture, clicking the Spark instance group SIG3 on the dashboard included above; the dashboard below shows the updated metrics for only Spark instance group SIG3, excluding all other Spark instance groups:

Kibana Timelion visualizations with Spark resource usage metrics
Timelion is a Kibana plug-in that allows you to combine data sources driven by a simple expression language to retrieve time series data, perform calculations, and visualize the results.
An IBM Spectrum Conductor Timelion sheet is included in the sample; it provides visualizations fed by the Spark resource usage metrics from your IBM Spectrum Conductor cluster. You can modify any of the visualizations, including the dashboard, to fit your business needs and then save them as Kibana dashboard panels to add to a Kibana dashboard.
To use the IBM Spectrum Conductor Timelion sheet:
- Click Timelion in the left navigation.
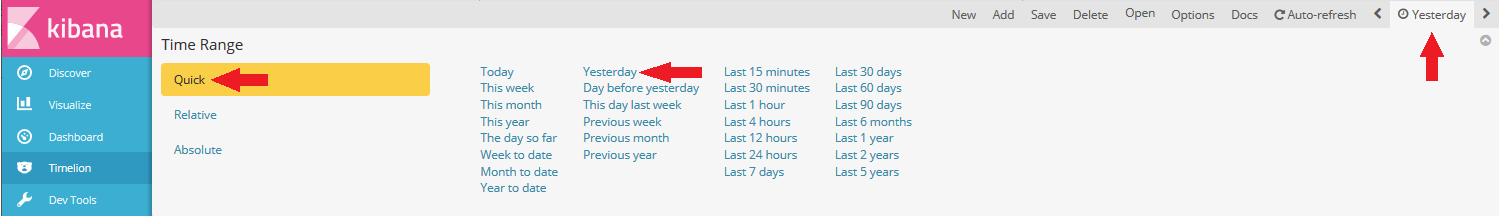
- Click Yesterday in the top navigation. This expands the Time Range section.
- Select Quick and Yesterday to modify the time range to yesterday.
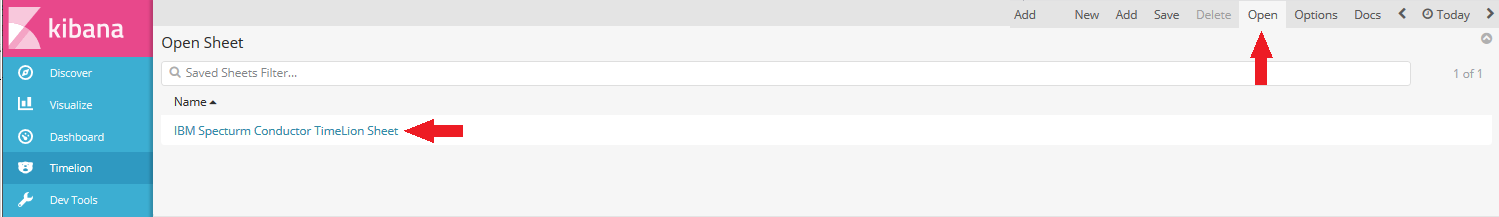
- Click Open in the top navigation. This expands the Open Sheet section.
- Select IBM Spectrum Conductor Timelion Sheet to load the sample:
The IBM Spectrum Conductor Timelion sheet consists of the following visualizations:
- Allocated Slot Usage Over Time – A line graph that plots the total allocated slots for the entire cluster over time, and also plots another series with data from the previous day. This is useful for comparing resource usage between days:

- Rate of Change in Allocated Slot Usage Over Time – A line graph that plots the change in allocated slot usage over time. This is useful for observing increases or drops in resource usage:

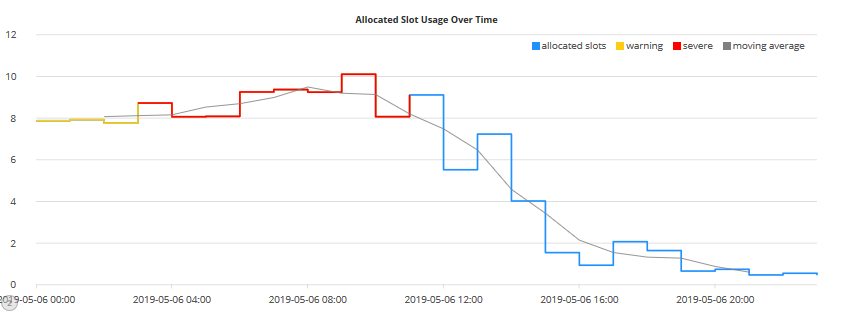
- Allocated Slot Usage Over Time – A line graph that plots the total allocated slots for the entire cluster over time. The graph highlights thresholds above six slots, as a warning in yellow, and thresholds above eight slots, as severe in red. This graph plots a moving average of the sum of the allocated slots with a window of four data points. This is helpful to track noisy time series. Thresholds are useful for observing outliers in your data:
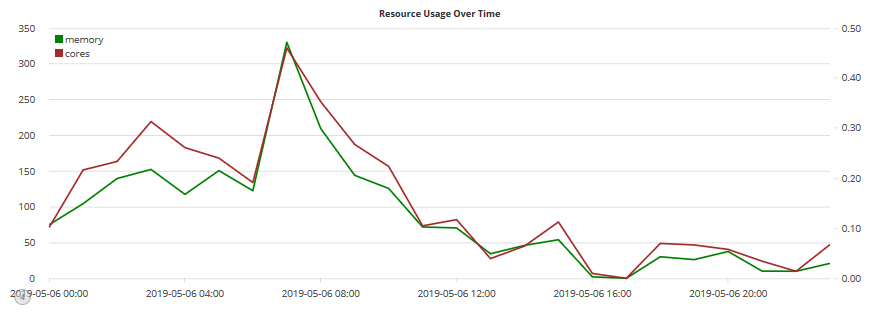
- Resource Usage Over Time – A line graph that plots the total memory and CPU core usage for the entire cluster over time using separate y-axes. This is useful for comparing two series that have different ranges of values:
Give it a try!
Now that you learned about Kibana with IBM Spectrum Conductor and Kibana Timelion visualizations, with this final blog in the search, analyze, and visualize Spark application data with IBM Spectrum Conductor series, try out the visualizations included in the downloadable sample. This concludes this three-blog series.
If you have any questions or want to let us know what charts you may be interested in, post them in our forum, or join us on Slack!
UID
ibm16163353