General Page
The dashboard graphically displays the following information:
- See if the system is running without error. If there's an error, see what kind of error is detected.
- See basic tape related configuration like how many pools there, how much of space is available.
- See the time-scaled storage consumption for each tape pool.
- See I/O throughput of each drive for migration and recall.
The dashboard uses the open-source software, Logstash™, Elasticsearch™, and Grafana™ for collecting the statistics from the IBM Spectrum Archive EE nodes and for rendering the information.

Note: Starting from version 1.3.2.2, IBM Spectrum Archive Enterprise Edition product installation package no longer redistributes the required open source packages: elasticsearch, logstash, and grafana. Support for those packages can be acquired for a fee by contacting a third-party provider. It is not covered by the IBM Spectrum Archive Enterprise license and support contract.
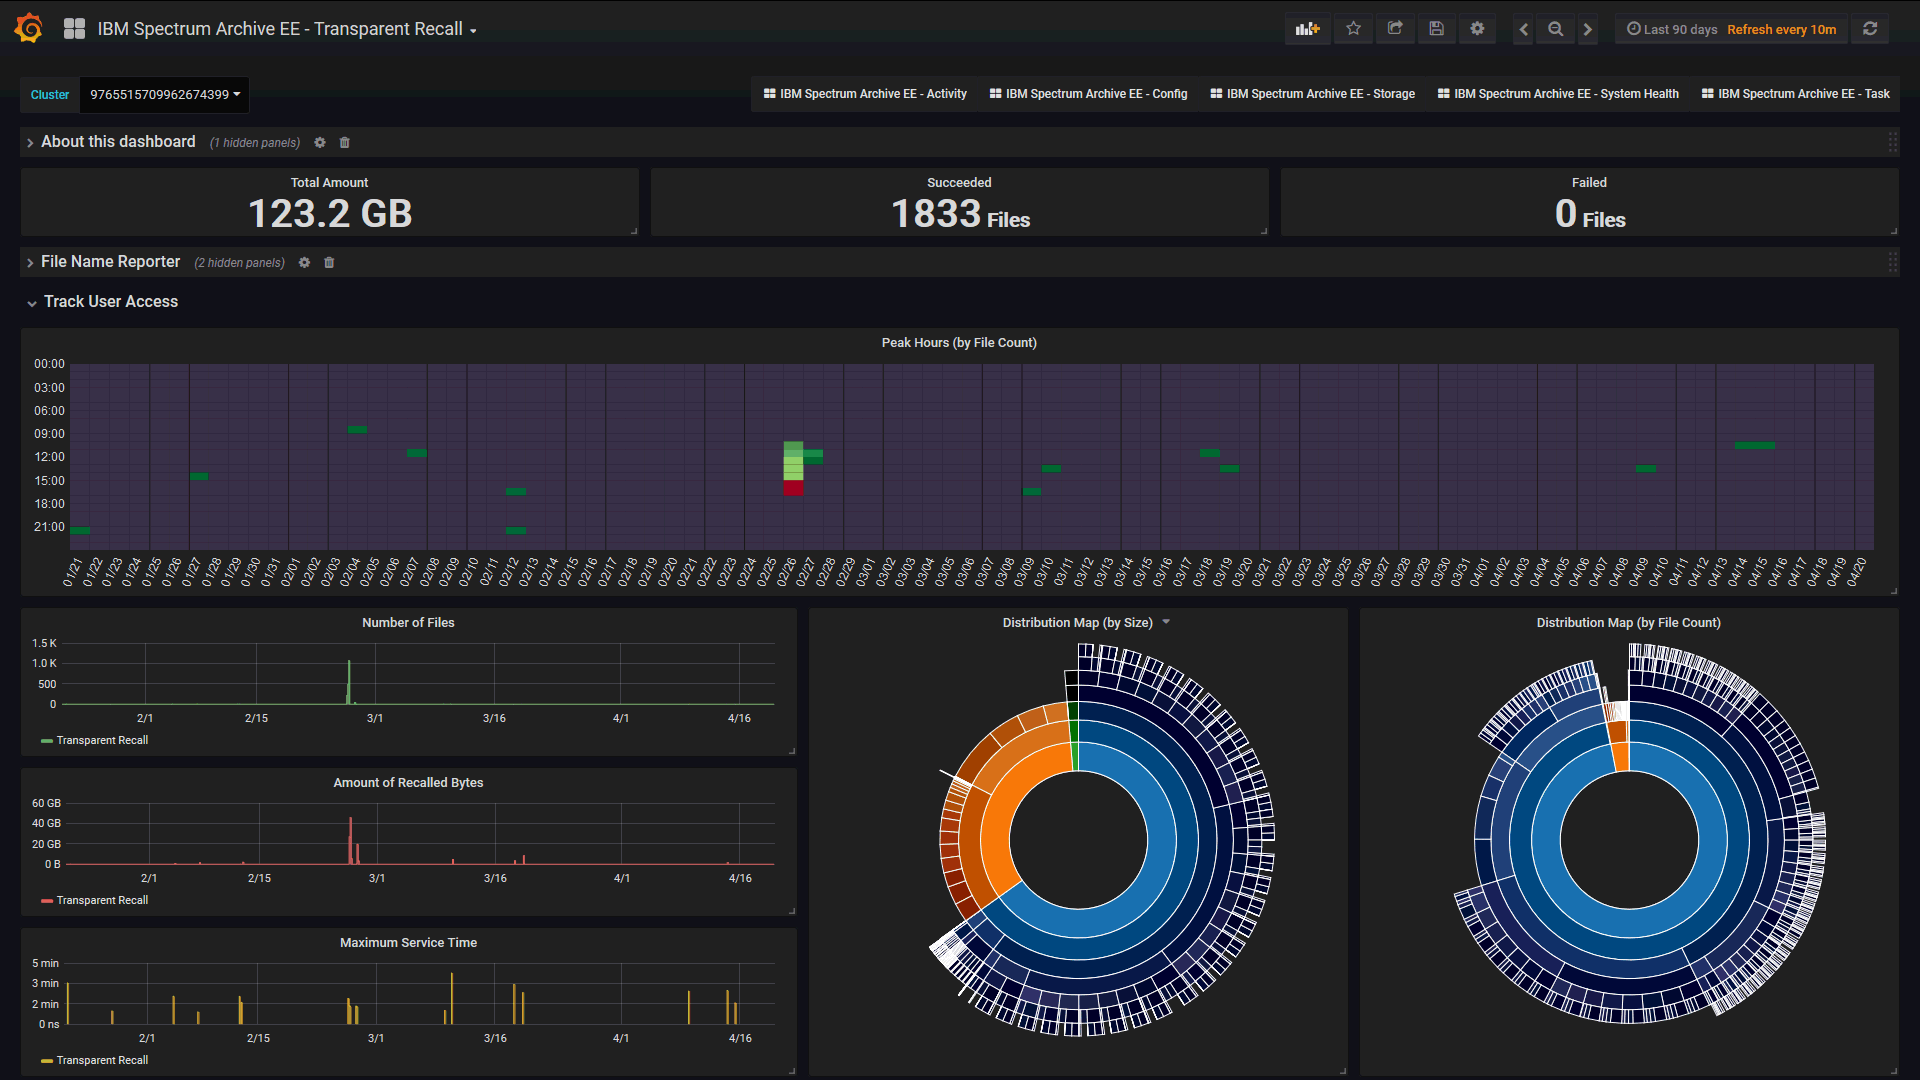
Here is a sample page of the dashboard:

Dashboard panel customized with a third-party plug-in:
Was this topic helpful?
Document Information
Modified date:
19 January 2022
UID
ibm16156051