Question & Answer
Question
What logs could be collected when you experience a problem with remote debugging in IBM Developer for z/OS?
Answer
For issues on the host, see the "Read first" document on the related information section.
For remote debugging, the possible logs are:
-
IBM Developer for z/OS (IDz) client-side debugger
-
Debug manager on the host
-
IDz user log (rsecomm.log) on the host
-
Program being debugged on the host
-
Dump on host
-
Verify that the firewall port is open
All these logs need to be in sync when sent to IBM Support.
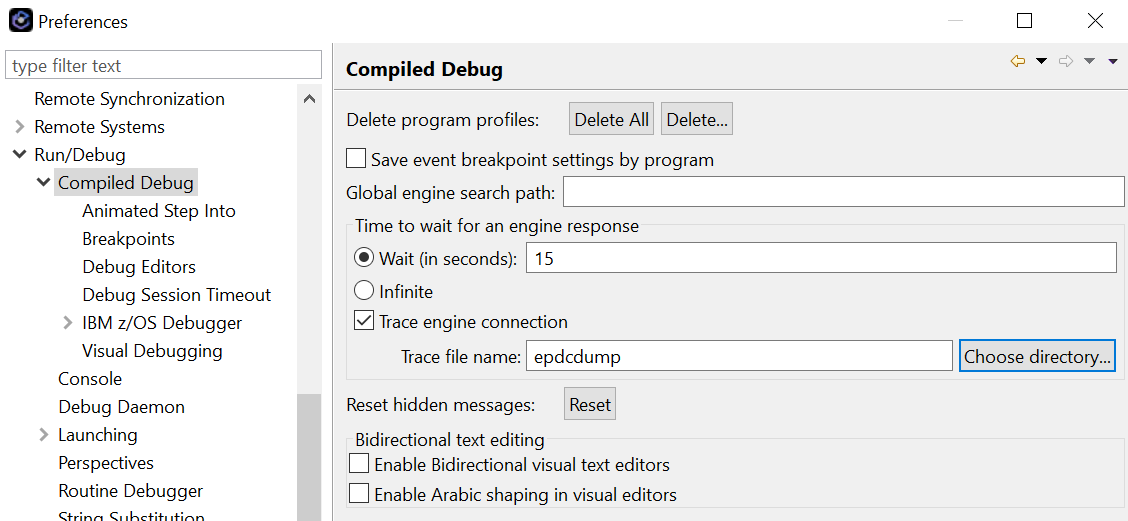
- Enable EPDC traces in IDz client in menu
Window > Preferences > Run/Debug > Compiled Debug
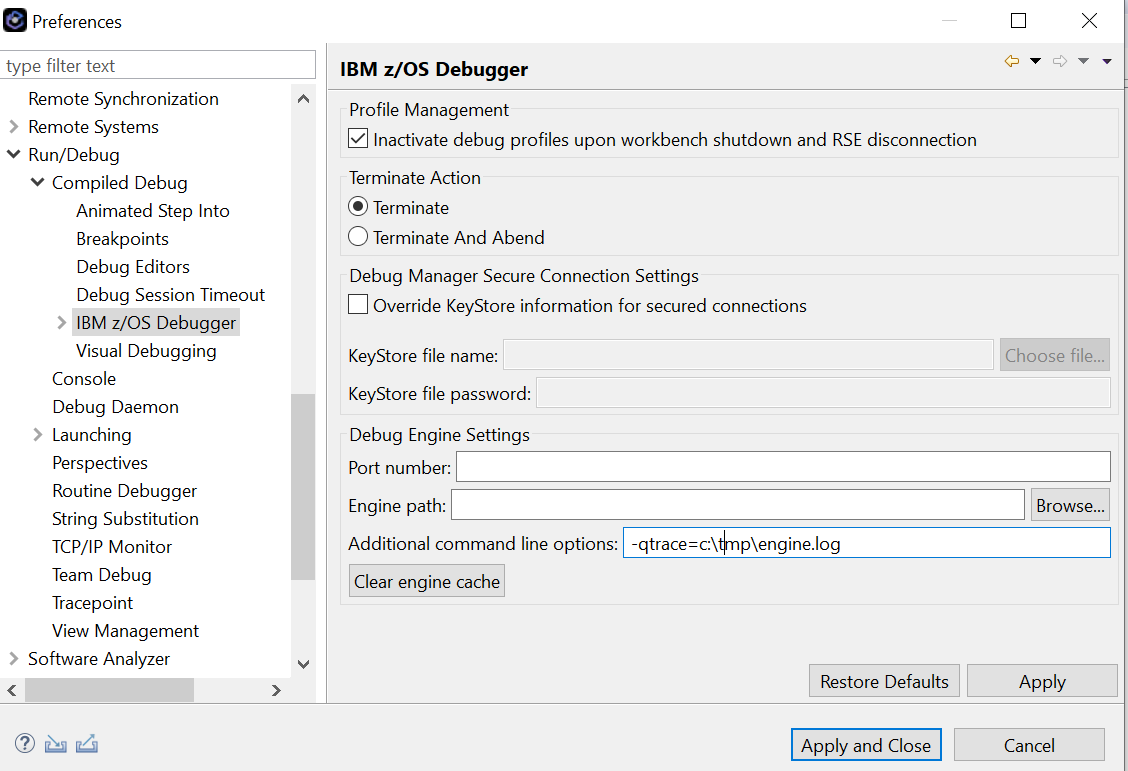
- If you use TEST(DBM) option, then enable the Debug engine traces by adding the following option in menu
Window > Preferences > Run/Debug > Compiled Debug > IBM z/OS Debugger
-qtrace=c:\tmp\engine.log
If you select c:\temp as directory, then IDz debugger creates files like
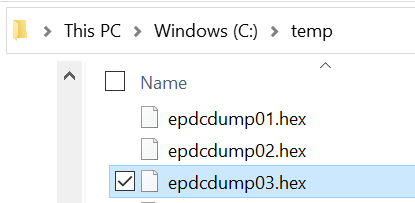
-
Finally, the workspace log can also give information on errors:
your workspace\.metadata\.log
Debug manager
- Check whether a user is connected to Debug Manager with the following operator command:
F DBGMNG,APPL=(DBM,D,U)
- Enable Debugger Manager traces with the following operator command:
F DBGM095,APPL=(DBM,LL,D)
IDz server
Program being debugged
- Enable probe traces that use environment variables EQA_DBG_TRACE in your JCL:
//CEEOPTS DD *
TEST(,,,DBMDT%user1:*)
ENVAR("EQA_DBG_TRACE=/tmp/myprogdbg.log")
/*
- For CICS DTCN/CADP profile, indicate EQA_DBG_TRACE=3 as ENVAR under "Other Language Environment Options", like for example: ENVAR("AQE_DBG_V4LIST=//'USER182.COBOL.LISTING'","EQA_DBG_TRACE=3")
The output goes to CEEMSG DD.
Dump
See link section for specific information on generating a SYSMDUMP.
Firewall
The Debug Manager port needs to be opened on your firewall (port 5335 by default)
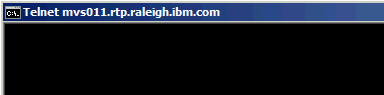
Connection can be tested with telnet command on the client, for example: 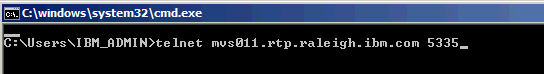
If it can connect, then it shows the following result:
Related Information
Was this topic helpful?
Document Information
Modified date:
12 October 2021
UID
dwa1210729