Technical Blog Post
Abstract
Measuring latching overhead with monitoring functions in Db2
Body
what is a latch?
Db2 is a multi threaded application written using the imperative programming model. Like any other multi threaded application, Db2 has its own mechanism to protect the common address base shared among the threads. It can be explained by the below given diagram: -
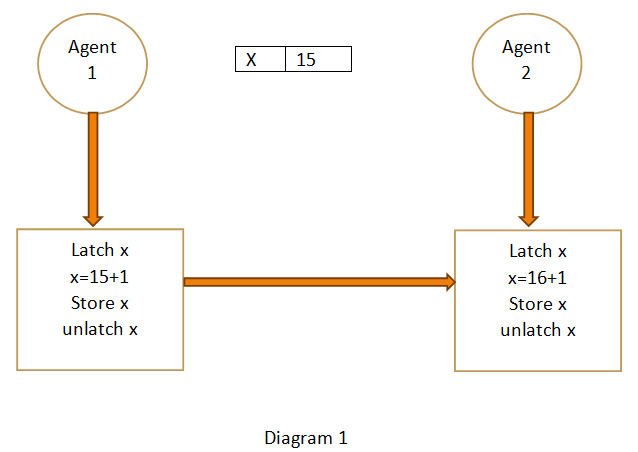
In the diagram, two threads are updating the same structure in the memory but the consistency is kept by latches. Next question for any Db2 DBA would be, what is different than lock/wait? It is an internal implementation of Db2 to protect shared resources. There can be different scenarios: -
1)Reader and reader: - If the two threads are doing a read operation then “No problem”. It does not have big impact on the concurrency.
2)Reader/writer: - If the operation is writing and reading or writing /writing by the two threads, it could cause some slowdown as db2 would need an exclusive latch to keep the data structure intact.
When and how to determine that system needs to be looked from the latching.
Db2 always acquire and release latches which are not even noticeable in most of the cases. It is a very fast operation within the precision of nanoseconds but in the highly concurrent systems having multiple cores processor, it is good to monitor latching overhead. In the older releases, db2pd infrastructure has been used to look into the latch waits but starting in V10.1 and V10.5, new table function MON_GET_EXTENDED_LATCH_WAIT has been introduced which uses SQL infrastructure to get information on the latch wait. It is a light weight and human readable. Extended means that the requester yielded CPU while requesting latch and considered as some contention on the database.
Example
db2 "select substr(latch_name,1,32) as latch_name,TOTAL_EXTENDED_LATCH_WAITS,TOTAL_EXTENDED_LATCH_WAIT_TIME from table(mon_get_extended_latch_wait(null))"
TOTAL_EXTENDED_LATCH_WAIT_TIME: -The amount of time, in milliseconds, spent in extended latch waits. This is an accumulative number from the time of database was activated.
LATCH_NAME TOTAL_EXTENDED_LATCH_WAITS TOTAL_EXTENDED_LATCH_WAIT_TIME
-------------------------------- ------------------------- ------------------------------
SQLO_LT_NO_IDENTITY 14565 11
SQLO_LT_SMemPool__MemLatchType__ 10 18
SQLO_LT_SQLB_HASH_BUCKET_GROUP_H 16699 10848050
SQLO_LT_SQLD_PARSCAN__prefetchLa 71 54
SQLO_LT_SQLB_BPD__bpdLatch_SX 565 5419
SQLO_LT_SQLB_POOL_CB__extentAnch 3 44
SQLO_LT_SQLD_TCB__loadInProgress 4 32
SQLO_LT_ABPDispatcher 3 0
SQLO_LT_ABPDistributor 3 2
In the above example, it is an OLTP highly concurrent system and SQLB latches are noticeable. SQLO_LT_SQLB_HASH_BUCKET_GROUP is the one hot latch. The reason for picking it as a hot latch is based on the problem definition i.e. gradual slowdown when the concurrent queries execute on the system and component it is related to i.e. bufferpool (SQLB). Next step would be to find out, how can it be avoided?
MON_GET_PKG_CACHE_STMT:- This table function can be used to find out the SQL details based on the average latch wait.
db2 "select substr(stmt_text,1,50) as stmt_text,decimal(float(total_extended_latch_wait_time)/num_executions,10,5)as avg_latch_time from table(mon_get_pkg_cache_stmt(null,null,null,null)) where num_executions > 0 order by avg_latch_time desc fetch first 10 rows only"
STMT_TEXT AVG_LATCH_TIME
---------------------------------------- --------------
Select Count(Distinct S_I_ID) from STOCK 48.60632
Select S_QUANTITY, S_DIST_01, S_DIST_02, 0.26249
Update STOCK set S_QUANTITY = ?, S_YTD = 0.26086
Update ORDER_LINE set OL_DELIVERY_D = ? 0.00067
Select OL_I_ID, OL_SUPPLY_W_ID, OL_DELIV 0.00027
Select O_OL_CNT, O_C_ID from ORDERS wher 0.00024
Update ORDERS set O_CARRIER_ID = ? where 0.00022
Select D_NAME, D_STREET_1, D_STREET_2, D 0.00017
Insert into NEW_ORDER values (?, ?, ?) 0.00011
Insert into ORDER_LINE values (?, ?, ?, 0.00008
Note, sometime latches are not related to the SQL execution so latch name might not have statement associated to it. Mostly in highly concurrent OLTP workload this SQL infrastructure can help to determine the overhead on the bufferpool latches and see if the queries can be tuned or avoid the access to hot pages in the bufferpool. Few basic techniques suggested on bufferpool related latches: -
• In above simple example, all hot statements are heavily biased to index access (this can be seen in monitor data and access plans)
• This suggests some internal contention around an index page due to the extremely heavy activity
• General tip: you can often reduce contention by breaking up a single resource into multiple (smaller) ones. Example would be range partitioning/add more indexes.
CONCLUSION
Latches are required in database and usually acts as a switch ON/OFF which is very fast operation. When doing a health check look holistically and find a tipping point for the performance problem and then see how much quantification should go to the concurrency which would lead into assessing your database for latching. One example would be high CPU utilization when there is more workload on the system leads into slowdown after some time.
It is out of the scope of this article to include all the details about latching because it requires study of the environment/symptoms and source code of DB2.
REFERENCE
UID
ibm13286785