Troubleshooting
Problem
Resolving The Problem
- If any of these tests indicate network issues, you might require the assistance of your network administrator in your organization.
- Use an SSH connection to verify that you have connectivity to the appliance on TCP port 22.
- From the Console SSH to the Managed Host listed in the Dashboard Notification.
- If you cannot SSH to either the Console or the Managed Hosts, use a Management Interface such as an IMM or iDRAC to get command-line access
Verify the network interface is active
A QRadar appliance has four or more LAN connections. QRadar interfaces start with an en (Ethernet) designation, which is used with the management and monitor interfaces. Since QRadar uses interfaces for docker and other internal functions in this example, we are adding the grep command to isolate the en interfaces.
Test 1: Verify the network interface configuration
- Use SSH to log in to the QRadar appliance as the root user.
- To verify the state of the network interface, type:
ip address show | grep en
For example,[root@qradar74 ~]# ip address show | grep en 1: lo: <LOOPBACK,UP,LOWER_UP> mtu 65536 qdisc noqueue state UNKNOWN group default qlen 1000 2: ens3: <BROADCAST,MULTICAST,UP,LOWER_UP> mtu 1500 qdisc pfifo_fast state UP group default qlen 1000 inet 192.168.1.68/24 brd 192.168.1.255 scope global ens3 3: ens4: <BROADCAST,MULTICAST,UP,LOWER_UP> mtu 1500 qdisc pfifo_fast state UP group default qlen 1000 inet6 2001:db8:4::1/80 scope global tentative inet6 fe80::1/64 scope link tentativeNote: en refers to ethernet, wl is for a wireless LAN adapter, and ww is for wireless wide area network. - Review the output to determine whether any settings appear to be incorrect:
- Verify the IP addresses are configured with the expected value for the appliance.
- Verify the transmission speed settings. Gigabit interfaces are expected to be configuration as qlen 1000.
- The interface is UP, indicating the interface is active.
- The MTU is configured to 1500.
Test 2: Review the transmission statistics for the interface
- Use SSH to log in to the QRadar appliance as the root user.
- To view interface statistics, type:
ip -s a s <interface>
For example,[root@qradar74 ~]# ip -s a s ens3 2: ens3: <BROADCAST,MULTICAST,UP,LOWER_UP> mtu 1500 qdisc prio state UP group default qlen 1000 link/ether 52:54:00:1c:1c:34 brd ff:ff:ff:ff:ff:ff inet 192.168.1.68/24 brd 192.168.1.255 scope global ens3 valid_lft forever preferred_lft forever inet6 fe80::5054:ff:fe1c:1c34/64 scope link valid_lft forever preferred_lft forever RX: bytes packets errors dropped overrun mcast 80135 1120 0 0 0 0 TX: bytes packets errors dropped carrier collsns 62641 537 0 0 0 0 - Review the output for errors, dropped packets, or interface collisions.
Using ethtool to troubleshoot LAN Interfaces
The ethtool command retrieves the status of the Ethernet interface. Settings to take note of are Speed, Duplex, Auto-negotiate, and Link detected. The first three if not set correctly it might adversely affect performance of the appliance. The Link detected informs you whether the LAN interface is connecting to another device such as a switch or router. If the Link detected is down, it might be an indication that the LAN Cable or LAN interface is bad.
Procedure
- Use SSH to log in to the QRadar appliance as the root user.
- Type:
ethtool <interface>
For example,
If Duplex is set to half, that would mean the interface either transmits or receives packets, but not at the same time. Full Duplex is preferred due to simultaneous transmission and receipt of packets. Auto-negotiate determines the best state for Duplex and the speed of the interface. If there are issues with your switches, routers, or network manually changing these settings might be required.
- Use an SSH session to log in to the appliance you need to test.
- Type the ethtool command:
ethtool -S <interface>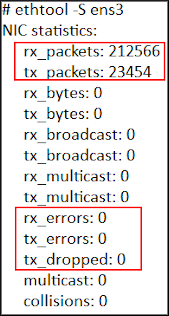
ethtool -p <interface>CTRL-C.Using netstat to troubleshoot ports
The netstat command is helpful for determining port information. On a QRadar appliance, you might see a warning that you cannot connect to port 32006. Use the netstat command to test whether the port is open or blocked by a firewall rule, and is listening.
- Use an SSH session to log in to the appliance you need to test.
- Type the command:
netstat -nap | grep :<port>
For example,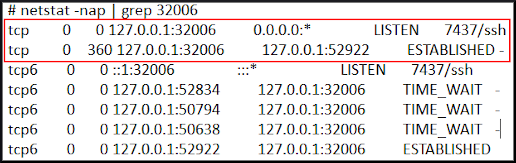
- Verify the port displays LISTEN, ESTABLISHED, or TIME_WAIT.
Results
In this example, the port is not blocked and is listening.
For more information on the netstat command, see Searching for ports in use by QRadar.
Using traceroute and tracepath to troubleshoot network latency
The traceroute command is useful in troubleshooting network problems, since the packets you send have to go through various networks and routers to reach their destination. If there is an issue with a busy network, it can also show the path with the highest traffic or where a network connection fails. In a local network, traceroute can give insight to whether a router is malfunctioning or if connectivity problems exist between hosts.
To use traceroute.
- Use an SSH session to log in to the appliance you need to test.
- Type the command:
traceroute <destination IP address>
Example of a successful connection with low latency:
Example of unsuccessful connection with high latency:
Note: Since traceroute uses ICMP, which is often blocked, instead try tracepath, which uses tcp socket link TCP port 22
Example,
Using the arping command to locate duplicate IP address in use
The arping command with the -D switch enables Duplicate Address Detection. When run from the local host, which cannot connect to the network, it can detect whether another host is using the same IP address.
Test 1: Verify whether duplicate IP addresses exist.
# arping -D -w 5 -I ens3 192.168.0.80
ARPING 192.168.0.80 from 0.0.0.0 ens3
Sent 6 probes (6 broadcast(s))
Received 0 response(s)
- Use an SSH session to log in to the appliance you need to test.
- Type the command:
arping -D -w 5 -I <interface> <IP address>
Example of host with duplicate IP address in use:# arping -D -w 5 -I ens3 192.168.0.80 ARPING 192.168.0.80 from 0.0.0.0 ens3 Unicast reply from 192.168.0.80 [52:54:00:1B:CA:6B] 8.555ms Sent 1 probes (1 broadcast(s)) Received 1 response
Example of no duplicate IP address in use:# arping -D -w 5 -I ens3 192.168.0.80 ARPING 192.168.0.80 from 0.0.0.0 ens3 Sent 6 probes (6 broadcast(s)) Received 0 response(s)
Verifying MAC address
HWADDR in /etc/sysconfig/network-scripts/ifcfg-* should match the MAC addresses in "ip link" command.
# ip link
1: lo: <LOOPBACK,UP,LOWER_UP> mtu 65536 qdisc prio state UNKNOWN mode DEFAULT group default qlen 1000
    link/loopback 00:00:00:00:00:00 brd 00:00:00:00:00:00
2: ens3: <BROADCAST,MULTICAST,PROMISC,UP,LOWER_UP> mtu 1500 qdisc prio state UP mode DEFAULT group default qlen 1000
    link/ether 52:54:00:1c:1c:34 brd ff:ff:ff:ff:ff:ff
3: ens4: <BROADCAST,MULTICAST,UP,LOWER_UP> mtu 1500 qdisc prio state UP mode DEFAULT group default qlen 1000
    link/ether 52:54:00:68:58:21 brd ff:ff:ff:ff:ff:ff
4: docker0: <NO-CARRIER,BROADCAST,MULTICAST,UP> mtu 1500 qdisc noqueue state DOWN mode DEFAULT group default
    link/ether 02:42:60:05:72:f1 brd ff:ff:ff:ff:ff:ff
5: dockerApps: <BROADCAST,MULTICAST,UP,LOWER_UP> mtu 1500 qdisc noqueue state UP mode DEFAULT group default
    link/ether 02:42:30:08:42:b6 brd ff:ff:ff:ff:ff:ff
29: veth605dcb0@if28: <BROADCAST,MULTICAST,UP,LOWER_UP> mtu 1500 qdisc noqueue master dockerApps state UP mode DEFAULT group default
    link/ether fa:d5:a3:cf:a3:ca brd ff:ff:ff:ff:ff:ff link-netnsid 6
31: vethda4e4bb@if30: <BROADCAST,MULTICAST,UP,LOWER_UP> mtu 1500 qdisc noqueue master dockerApps state UP mode DEFAULT group default
    link/ether d6:08:f3:ae:4e:d3 brd ff:ff:ff:ff:ff:ff link-netnsid 7
Was this topic helpful?
Document Information
Modified date:
04 October 2021
UID
swg21997106