Troubleshooting
Problem
Diagnosing The Problem
Resolving The Problem
Part I: Enable traces for access log:
1. From the Administrative Console, go to Servers > Server Types > WebSphere application servers > server_name > Web Container Settings > Web container transport chains > Click on transport chain application is using (by default WCInboundDefault for http requests AND WCInboundDefaultSecure for HTTPs requests) > Click on HTTP inbound channel
** If you are using https requests, make sure to ALSO make the change as shown below for "WCInboundDefaultSecure" **
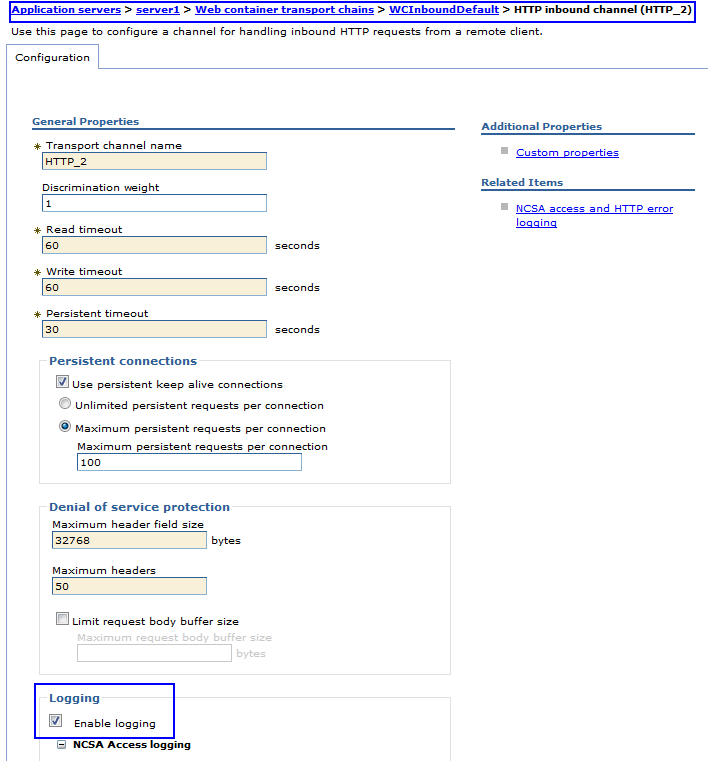
2. Under "Logging", check "Enable logging" check box
3. Expand NCSA Access logging and select "Use chain-specific logging"
4. Make sure "Enable access logging" is checked and add following values for these fields
- Access log file path: ${SERVER_LOG_ROOT}/http_access.log
- Access log maximum size: 500
- Maximum number of historical files: 1
- NCSA access log format : Common
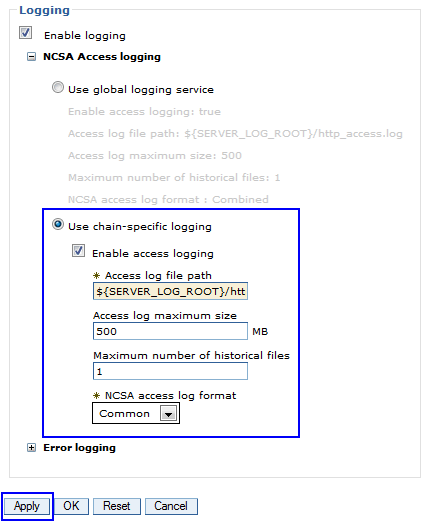
5. Click on Apply
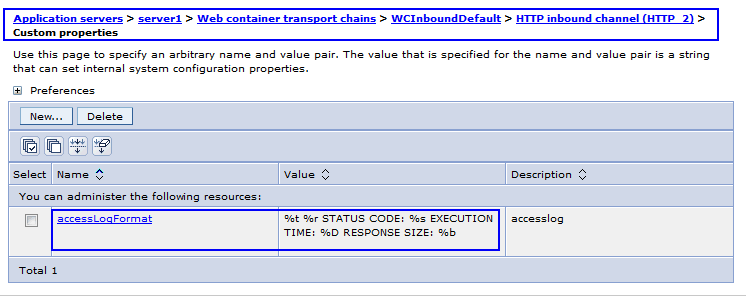
6. Under "Additional Properties" on the same panel (#1 above), click on "Custom properties"
7. Click New and add accessLogFormat as Name and %t %r STATUS CODE: %s EXECUTION TIME: %D RESPONSE SIZE: %b as Value
** Note: This outputs the times in microseconds (not milliseconds) so you need to convert microseconds to whatever measurement you are monitoring
8. Click on Apply and "Save" changes
9. Go to Servers > Server Types > WebSphere application servers > your_server
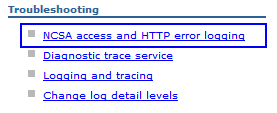
10. Under "Troubleshooting" click on "NCSA access and HTTP error logging"
11. Make sure "Enable logging service at server start-up" check box is checked
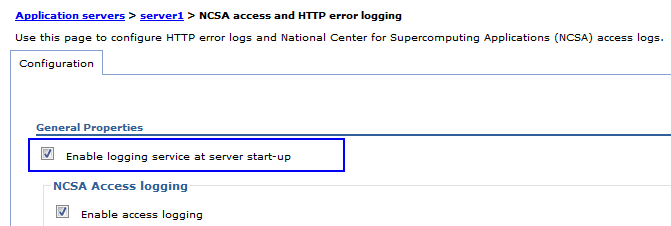
12. Click "Apply" and "Save" changes
13. Restart the JVM to enable the changes
14. Recreate the issue and send IBM the http_access.log file for review so we can determine which URI took the longest time.
Part II: Enable Request metrics:
Once IBM support has analyzed the access log from Part I, they will tell you what URI or URIs to use to enable Request Metrics on.
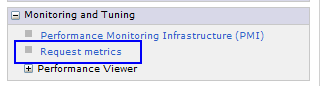
1. From the Administrative console on the left pane under "Monitoring and Tuning" click on "Request metrics"
2. Enable request metrics by selecting "Prepare Servers for Request metrics collection"
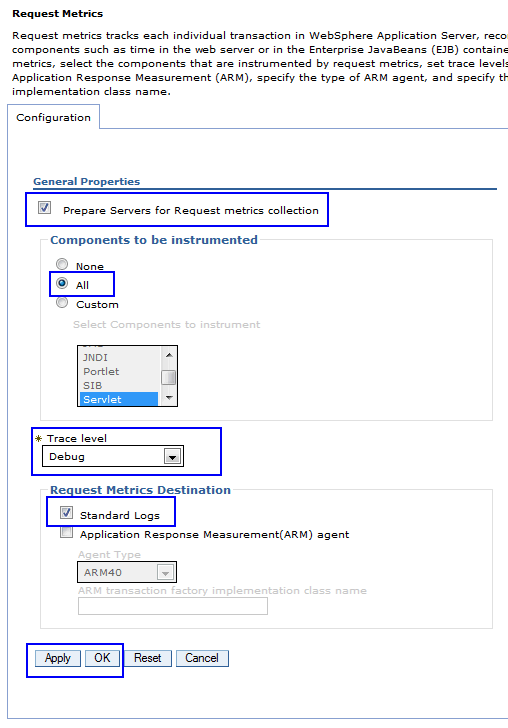
3. Select "All" radio button under "Components to be instrumented"
4. Select trace level to "Debug"
5. Check "Standard Logs" check box under Request Metrics Destination
6. Click "Apply" and "Save" changes
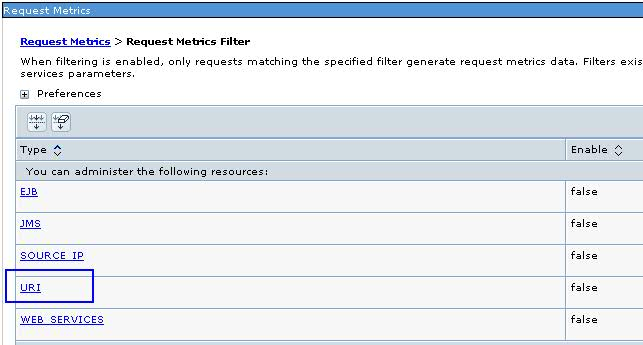
7. From that screen, click on "Filters" under Additional Properties on the right then select "URI"
8. Select "Filter Values" under Additional Properties on the right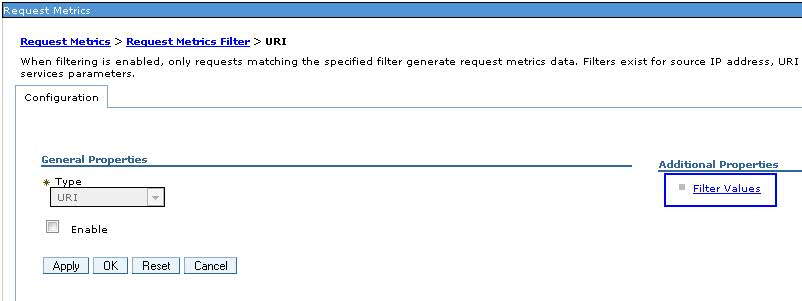
9. Add a new filter and give the value of your URI (Click on “New”)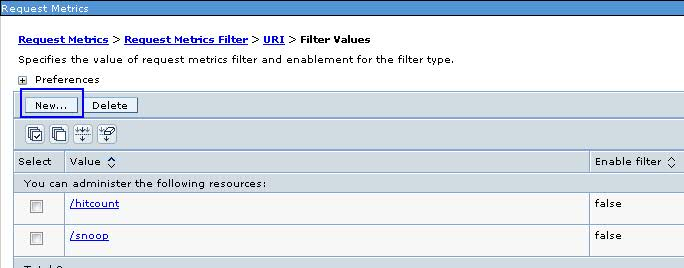
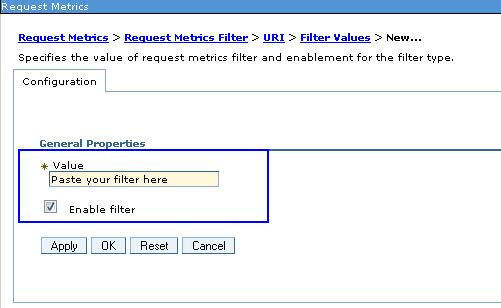
10. Paste the URI (all one string) into that field:
<your_filter_here>
On the same screen enable check box for "Enable filter"
11. Click “Apply” and “Save” changes
Configure the hang detection policy:
1. From the Administrative console, click Servers > Server Types > WebSphere application servers > server_name
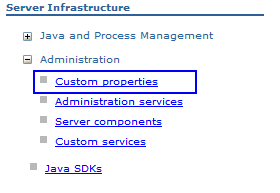
2. Under Server Infrastructure, click Administration > Custom properties
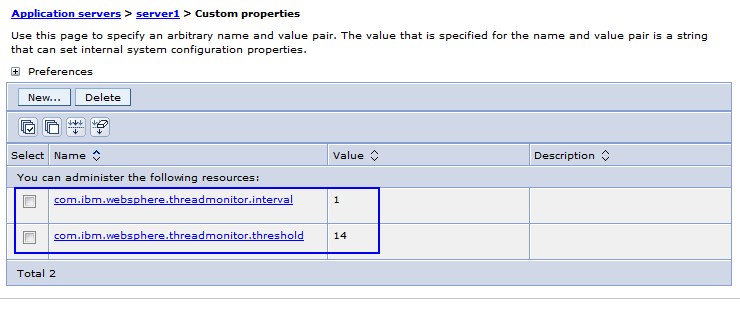
3. Click New and add the following name and value pairs
- Name: com.ibm.websphere.threadmonitor.interval Value: 1
- Name: com.ibm.websphere.threadmonitor.threshold Value: X where X = |(total delay)/2| e.g. If total delay is 28 seconds, value of this parameter is |28/2| = 14
- Name: com.ibm.websphere.threadmonitor.false.alarm.threshold Value:0 (this will prevent automatic adjustment to threshold value)
4. Click “Apply” and “Save” changes
For WebSphere 8.5.X and above only - Configure cross component tracing :
1. From the Administrative Console, go to Servers > Server Types > WebSphere application servers > server_name
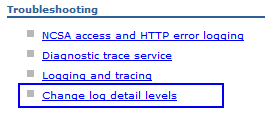
2. Under "Troubleshooting" click on "Change log detail levels" (you can get to this panel by clicking "Logging and tracing > Diagnostic Trace > Change log detail levels under Additional properties)
3. Under "Correlation", check the "Enable log and trace correlation" check box
4. Select third radio button "Include request IDs in log and trace records, create correlation log records and capture data snapshots"
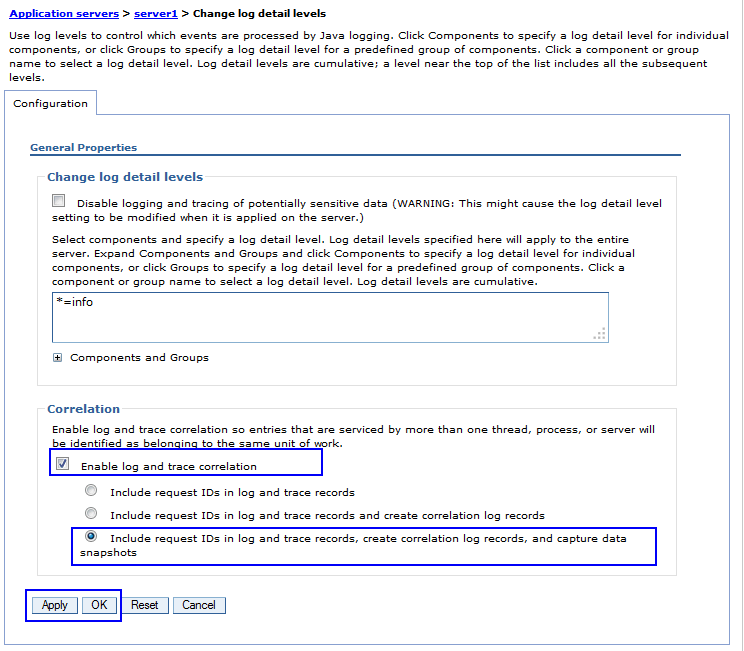
5. Click “Apply” and “Save” changes
Recreating the problem:
1. Stop the Application Server
2. Take a backup if needed and clear all Application SErver logs. The log files by default are located in the following directory: install_root/profiles/profile_name/logs/server_name
(Note: If you have configured to write Application Server log files into a different location, then clear them accordingly)
- native_stderr
- native_stdout
- SystemErr
- SystemOut
3. Clear all WebSphere Application Server FFDC logs. FFDC files are located in the following directory: install_root/profiles/profile_name/logs/
(Note: If you have configured to write FFDC log files into a different location, then clear them accordingly)
4. Start the server and recreate the problem
Submit following information to IBM:
1. Provide URL under question and time stamp when it's accessed
2. The Application Server logs, such as the following logs:
- native_stderr
- native_stdout
- SystemErr
- SystemOut
- http_access.log
- verbosegc logs if that is redirected
3. FFDC logs with the current date from the following directory:
install_root/profiles/profile_name/logs/ffdc
4. The server.xml file that is located in the directory:
install_root/profiles/profile_name/config/cells/cell_name/nodes/node_name/servers/server_name
5. Send the files/information to IBM Support
Was this topic helpful?
Document Information
Modified date:
17 August 2023
UID
swg21661868