Technical Blog Post
Abstract
ITCAM for Transactions - Transaction Reporter - Displaying Historical Transaction Instances
Body
IBM Tivoli Composite Application Manager for Transactions
~ How to do stuff ~
By Kevin Baldwin -
 How to.....
Enable the display of Historical Transaction Instances in Transaction Reporter
What are Historical Transaction Instances?
Situations can be enabled that cause the Transaction Reporter to obtain the instance data for an aggregate record that exceeded certain thresholds. The Transaction Reporter performs a full instance trace and provides the Instance Rows and Instance Interaction Rows to the Tivoli Data Warehouse.
Transaction Reporter - Historical Transaction Instances data isn’t made available for reporting in the same way that historical data is for other agents or other Transaction Reporter aggregate data.
Historical Transaction Instances mustn’t be confused with the historical data you can access via the “Time Span” option in the Transactions workspace Transactions view.
The “Time Span” option isn’t needed and mustn’t be used to display Historical Transaction Instances data.
Historical data collection still needs to be defined and you also need to enable situations that will collect instance data when the situations become true as described below.
Setting up historical data collection
Historical data collection must be enabled for the following attribute groups:
- Transaction Instance Context
- Transaction Instance Interactions
- Transaction Instance Instances
You shouldn’t need to configure Summarisation controls for these reasons:
- · Aggregate data records are the summary of the Transaction Instance data
- · Only selected instance data is warehoused making summarised records less useful
You must define Pruning controls to prevent unbounded growth of the database.
You need to take account of the following information relating to the default “Transaction Instances for….” workspace view when deciding how much Detailed Data to keep:
- · The default query for this workspace view retrieves all rows from the “Transaction Instance Instances” table in ascending date order.
- · The “Time Span” option isn’t available
- · Do not use “Set Historical Navigation Mode”. Using this option prevents the display of any data with the following KFWITM491W message:
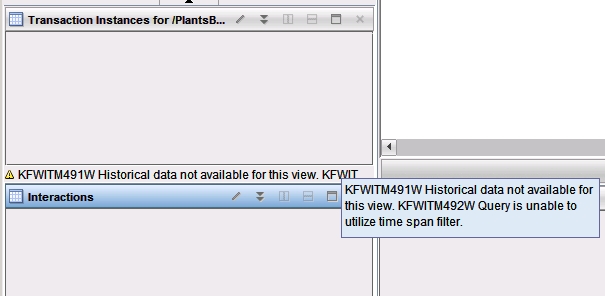
See the IBM Tivoli Monitoring User's Guide - Historical collection configuration for detailed information about history data collection.
Enable Failed_Transactions and Slow_Transactions situations
The process of configuring Historical Data Collection for the above Transaction_Instance tables does not add instance data to the warehouse.
To have instance data sent to the warehouse.you must enable the following default situations
Failed_Transactions:
The Failed_Transactions situation uses the Group Level and Percent Failed attributes and the KTO: REMEMBER AGGREGATE Take Action command (KTO: REMEMBER AGGREGATE &{Aggregates.Aggregate_ID} failed=1) to indicate a high failure rate for transactions within a topology.
By using this situation, you can see the nodes with a high failure rate (more than 50%) in the topology workspaces and identify the transaction instances that are causing the problem. Hover the mouse over Transactions in the Navigator to display details of the situation, agent, date and time, and aggregate name for the transaction that has failed.
The situation causes the Transaction Reporter to obtain the instance for the aggregate that triggered the command by exceeding the condition.
The Transaction Reporter performs a full instance trace and provides the Instance Rows and Instance Interaction Rows to the Tivoli Data Warehouse.
This situation is run every 5 minutes by default.
Slow_Transactions
The Slow_Transactions situation uses the Group Level and Response Time Deviation attributes and the KTO: REMEMBER AGGREGATE Take Action command (KTO: REMEMBER AGGREGATE &{Aggregates.Aggregate_ID} slow=1) to identify transactions that are slower than the baseline by 100% or more and store them in the Tivoli Data Warehouse.
The baseline is determined by the average of the response times over the last 24 hours (or custom History setting). This situation is run every 5 minutes by default.
The above situations instruct the reporter to explicitly warehouse instances via the KTO:REMEMBER AGGREGATE take action.
You can also:
- Create other situations that call the same take action
- Manually trigger the KTO: REMEMBER INSTANCE Take Action command from an instance view as described in Transaction Tracking Take Action commands
Transactions: Summary
This workspace provides general information about the performance of transactions on your managed system as described in the . Use this information to monitor transactions and determine if they have any problems.

Transaction Interaction Information table
| Column | Description |
| Name | The name of the Application, Component, Server, or Transaction. |
| Total Time | Measures the average time for a transaction to complete, in milliseconds. The value in this column does not include the time taken for failures, unless all transactions have failed. The Total Time measures the following transactions based on which category you are looking at:
|
| Total Time Deviation | Measures the percentage deviation from a baseline value. Positive numbers indicate a slower total time than the baseline value, and negative numbers indicate a faster total time than the baseline value. A deviation of zero indicates either that there is no deviation or that the deviation has not yet been measured. |
| Transaction Rate | Measures the average rate of transactions. This is measured in transactions per minute. The Transaction Rate calculates the following rate of transactions based on which category you are looking at:
|
| Transaction Rate Deviation | Measures the percentage deviation from a baseline value in the number of transactions. Positive numbers indicate more transactions than the baseline value, and negative numbers indicate fewer transactions than the baseline value. A deviation of zero indicates either that there is no deviation or that the deviation has not yet been measured. |
| Percent Failed | Indicates the percentage of transaction instances that have failed. |
| Percent Slow | Indicates the percentage of transaction instances that are running slower than a preset threshold. |
| Percent Good | Indicates the percentage of transaction instances that are running faster than a preset threshold. |
| Timestamp | Indicates the start time of the period of aggregation. |
| Enclosing Component | Enclosing component aggregate if applicable. |
| Enclosing Server | Enclosing server aggregate if applicable. |
The other views in this workspace are described in the ITCAM for Transactions User Guide.
Please note: It is not possible to view Topology for older Transactions data.
Topology accessed from this view only reflects the latest data. Using the “Time Span” option to view older Transactions data then selecting the Transaction Topology option will still display topology for the latest data, it does not display topology for the selected record.
To display topology and additional information for Historical Transaction Instances, click a link icon from the Transactions table view in the Transactions Summary workspace. This option is specific to the Transactions Summary workspace, and is not available from the other summary workspaces.
Open Historical Transaction Instances

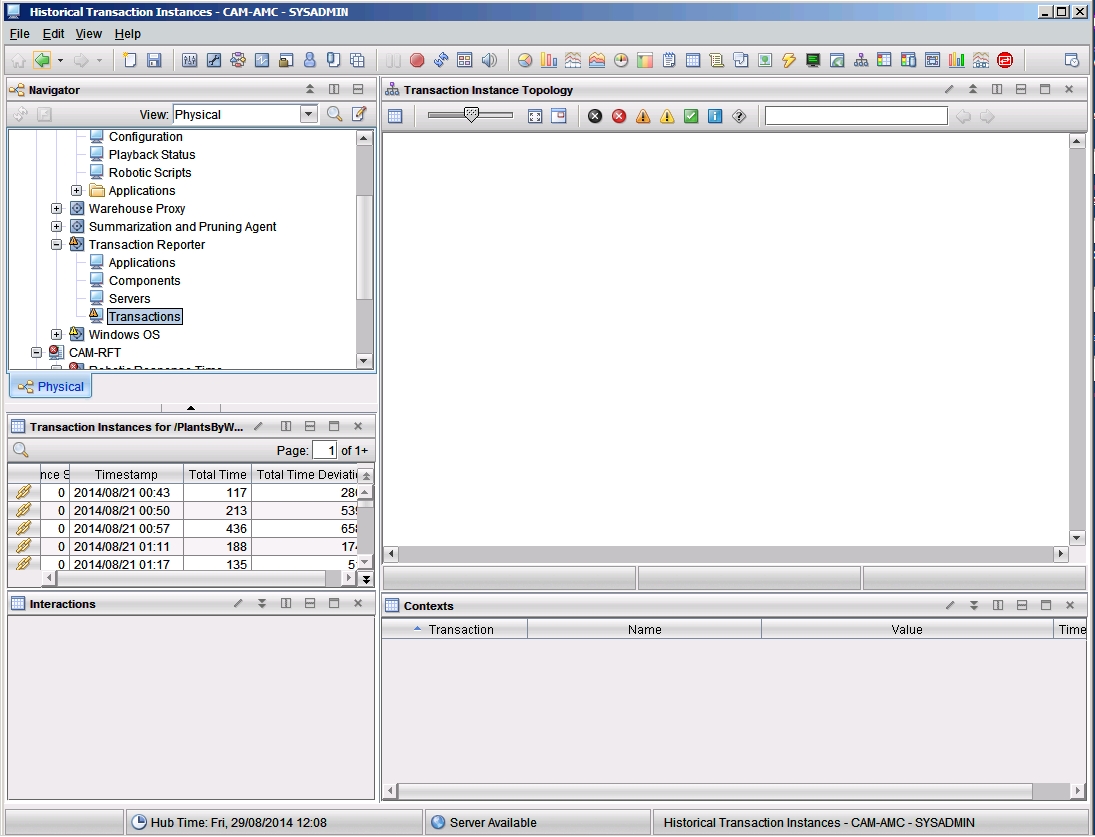
Transactions: Historical Transaction Instances
This workspace enables you to view individual historical transaction instances that are collected after enabling situations to store transaction instances that have failed or did not perform within set parameters.
Use this workspace to compare historical transaction instances with current transaction instances that are failing in a similar way. Access this workspace by clicking a link icon from the table in the Transactions Summary workspace.
Using this workspace
A transaction instance is a single occurrence of a transaction within your system. The Historical Transaction Instances workspace uses situations to display stored data from your system. Compare current data with historical data to determine if there is a pattern in transactions failing or running slow.
This workspace contains four views in addition to the standard Navigator view:
- Transaction Instance Topology
- Transaction Instances for…. [transaction name]
- Interactions
- Contexts
When you first enter this workspace, only the “Transaction Instances for….” view is populated.
The default query for this workspace view retrieves all rows from the “Transaction Instance Instances” table in ascending date order.
Description of the fields in the Transaction Instances table
| Column | Description |
| Instance Status | Indicates the status of the transaction instance:
|
| Total Time | Indicates the total time for the transaction instance, in milliseconds. |
| Total Time Deviation | Indicates the percentage deviation from a baseline value for the transaction instance. Positive numbers indicate a slower total time than the baseline value, and negative numbers indicate a faster total time than the baseline value. A deviation of zero indicates either that there is no deviation or that the deviation has not yet been measured. |
| Timestamp | Indicates the time a transaction instance started. |
To display a topology, Interactions and Contexts information, select a transaction instance from the table in the Transaction Instances for transaction name view and click Link to Instance Topology. It then displays the topology, Interactions and Contexts information for a single instance of a transaction.
Please note: Patience is sometimes needed.
After clicking on the link button you may see the Contexts view populated first followed by a delay before the Topology and Interactions views are populated.

A more detailed description of the views in this workspace is provided in the ITCAM for Transactions User Guide.
Visit the ITCAM for Transactions ~ How to do stuff ~ Homepage for more blogs in this series
UID
ibm11278814