Technical Blog Post
Abstract
ITCAM for Transactions 7.x: Robotic Response Time agent playback status and availability
Body
IBM Tivoli Composite Application Manager for Transactions
~ How to do stuff ~
By Kevin Baldwin -

How to.....
Correctly interpret playback status and availability information seen in Robotic Response Time workspaces
The information in this blog answers the following questions:
- Why is Last Run Status showing Complete when the monitored web server isn't available?
- Why is the application showing 100% availability when the monitored web server isn't available?
The quick answer to these questions is:
- Playback Status just reports the status of the playback execution. That is, did the playback run?
It does not report what happens during the playback.
The status of the playback can be "Complete" even if it monitored web server wasn't available.
- Availability percentages remain at 100% unless there's an ARM_FAILED return code from the playback.
ARM_FAILED can be returned only if Verification Points are used in the script and the Verification Point fails during playback.
For the full answer you need to understand how playback errors and availability percentages are reported in the TEP.
The workspace views seen below are all accessed from a RRT agents Robotic Response Time attribute in the TEP Navigator: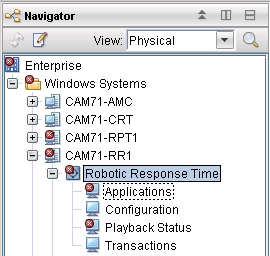
Playback failures and availability are reported in 4 ways
1. Robotic Script Playback Status
This view is seen in the Robotic Response Time > Playback Status workspace:
![[Robotic Script Playback Status]](/support/pages/system/files/inline-images/0587adbc-8477-431f-8c68-9226adea11ed_Robotic_Playback_Status_0.jpg)
The Last Run Status column reports the status of script execution.
The status reported here is not affected by availability failures detected during playback.
For example: URL Unavailable and HTTP Response Code verification point failures.
Playbacks that are not "In progress" will have a status of:
| Status | Description |
| Complete | The script started and completed playback |
| Failed | The script failed to execute This status will generate a Critical alert for the RRT_Playback_Failed situation |
| Timeout | Robotic Response Time exceeds the timeout period specified for this script in the corresponding AMCE profile This status will generate a Warning alert for the RRT_Playback_Timeout situation |
| Overrun | The script execution time is longer than the playback interval specified for this script in the corresponding AMCE profile This status generates a Warning alert for the RRT_Playback_Overrun situation |
2. Robotic Script Verification Point Failures
This view is seen in the Robotic Response Time > Playback Status workspace:![[Robotic Script Verification Point Failure]](/support/pages/system/files/inline-images/0587adbc-8477-431f-8c68-9226adea11ed_robotic_script_verification_point_failure1.jpg)
Entries seen in this view are the result of failed verification points defined in robotic scripts or a "timeout".
If Verification Points are not defined in robotic scripts, Event Types such as HTTP Return Code Failure, Page Title Failure, URL Unavailable will not be reported.
3. Percent Good / Percent Failed / Percent Slow / Percent Available
These "Percentage" columns are seen in various Robotic Response Time > Application and Transaction workspace table views displaying aggregate data.
For example:![[Application Current Status Details]](/support/pages/system/files/inline-images/0587adbc-8477-431f-8c68-9226adea11ed_AppCS_Status_Details_1.jpg)
| Column | Description |
| Percent Available | The percentage of transactions with a transaction status of Good or Slow but not Failed. The sum of this value and Percent Failed should total 100 percent. Any failure is considered important, so the table cell for this attribute is displayed in the TEP with a green background only when the value for Percent Available is 100 percent. Any value less than 100 percent is displayed in the TEP with a red background in the table cell. |
| Percent Slow | The percentage of transactions whose requests were marked as Slow. Requests are marked as Slow if the transaction response time exceeds the Minimum Response Time Threshold specified in the corresponding profile This value is calculated by dividing Slow Requests by Total Requests and multiplying by 100%. The sum of this value and the Percent Good value should equal Percent Available value. Any value that is greater than 0 percent is displayed with a yellow background in the TEP. |
| Percent Failed | The percentage of transactions whose requests were marked as Failed. Requests are marked as Failed if:
Verification Points are needed for ARM_FAIL to be returned when failures such as HTTP Return Code Failure, Page Title Failure, URL Unavailable happen. |
| Percent Good | The percentage of transactions whose requests were marked as Good. This is calculated by dividing Good Requests by Total Requests and multiplying by 100%. The sum of this value and the Percent Slow value should equal the Percent Available value. |
Percentages are based on the number of requests in a 5 minute aggregate period. Therefore, if a script runs every 5 minutes and you are using the default aggregation period of 5 minutes, the different percentages will normally have values of 0 or 100.
4. Situation Event Console
The Situation Event Console can be viewed at the Enterprise level or the agent level in the Robotic Response Time workspace as seen here:![[Situation Event Console]](/support/pages/system/files/inline-images/0587adbc-8477-431f-8c68-9226adea11ed_Situation_Event_Console_1.jpg)
This view shows events triggered by the situations used on this agent.
Events relate to conditions that you want to examine to determine if a potential problem exists in the systems and resources you are monitoring.
Robotic Response Time includes the following default situations:
RRT_Agent_Message_Critical
RRT_Agent_Message_Warning
RRT_Availability_Critical **
RRT_Availability_Warning **
RRT_Playback_Failed
RRT_Playback_Overrun
RRT_Playback_Timeout
RRT_Response_Time_Warning
RRT_Robotic_Realms
RRT_Verification_Point_Failure **
RRT_Verification_Point_Sampled **
** If Verification Points are not defined these situations cannot trigger events.
These situations are explained in more detail in the ITCAM for Transactions Users Guide:
Composite Application Manager for Transactions > User's Guide > Response Time > Situations
How to use RPT scripts to raise alerts on server errors is a technote that contains a pdf document that includes examples for defining custom situations and setting up Verification points in RPT scripts.
UID
ibm11278790