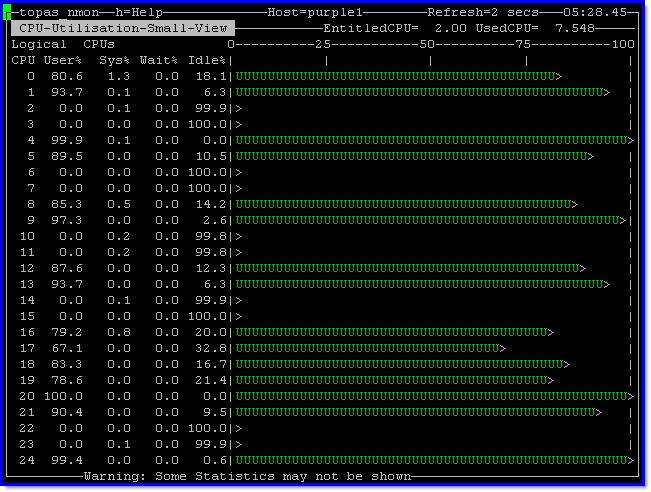
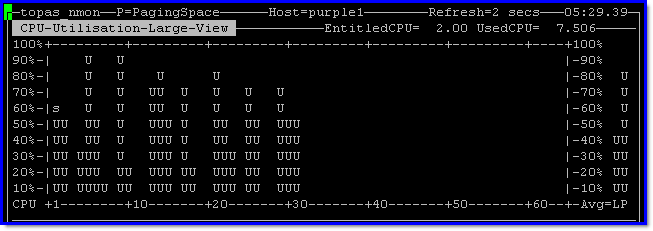
If you have too many CPUs to display in a stretched window, then use the C view or long-term view of the CPU total use.

Here is another question from that larger Power Server customer. Larger server and virtual machines not a large person! They have large virtual machines (Logical Partitions) and can't see all the CPUs on the screen. This issue is made worst by POWER7/8/9 servers - not a problem with the processors or machines but there are:
- So many CPUs on larger machines like Power 780, POWER8 E980 and POWER9 E980.
- Then, the new Simultaneous Multi-Threading (SMT) now means four and eight threads per physical CPU (core).
This issue results in many physical CPUs, each has many logical CPUs so the whole screen and more is filled. So what happens on the screen. The nmon AIX command outputs a warning like:

If you have 64 CPUs in your virtual machine and SMT=4 that is 256 lines of output - even the biggest screen can not cope. We tried reducing the font in PuTTY to 6 point and still no luck. Amazingly, we learned to read it this size font but it was easy to confuse "3" and "8" it is only one or two pixels different.
So what is the answer?
First Answer
- Instead of using "c" to see the logical CPUs use "C" (Capital "c") and you get the graphs smaller and vertically. See the following picture:
This view shows 64 CPUs at a time and if you have more CPUs, it shows multiple sets of 64 CPU up to 256 logical CPUs.
Second Answer
What I call "Long-Term stats" instead of dozens individual CPUs, we monitor the total server level utilisation.
This mode is started with "l" (lowercase L). See the following picture:

I added this mode when performance monitoring and tuning an Apache web server at a customer performing pre-production testing benchmarks a long time ago. It would change utilisation rapidly and confusingly on-screen so that it was hard to determine the overall changes in the performance. This longer term view, allows you to visually see the peaks, troughs, and rolling average over time. The vertical bar moved right with each data sample. Note the "+" character on the vertical bar at 65%. The "+" character is the current calculated average of what you can see on the screen. At 2 second intervals between updates and 72 data points across the screen that is roughly two and a half minutes. If you want to see a longer length of time, slow down the updated by typing "-". At eight seconds between updated, you get to see the last ten minutes.
This view also gets the Auto-scaling Physical CPU view (hit "#") from May 2011 - see the other AIXpert blog about that feature.
If you find errors or have a question, email me:
- Subject: nmon CPU views
- Email: n a g @ u k . i b m . c o m
[{"Business Unit":{"code":"BU058","label":"IBM Infrastructure w\/TPS"},"Product":{"code":"SWG10","label":"AIX"},"Component":"","Platform":[{"code":"PF002","label":"AIX"}],"Version":"All Versions","Edition":"","Line of Business":{"code":"LOB08","label":"Cognitive Systems"}},{"Business Unit":{"code":"BU054","label":"Systems w\/TPS"},"Product":{"code":"HW1W1","label":"Power ->PowerLinux"},"Component":"","Platform":[{"code":"PF016","label":"Linux"}],"Version":"All Versions","Edition":"","Line of Business":{"code":"","label":""}},{"Business Unit":{"code":"BU058","label":"IBM Infrastructure w\/TPS"},"Product":{"code":"SWG60","label":"IBM i"},"Component":"","Platform":[{"code":"PF012","label":"IBM i"}],"Version":"All Versions","Edition":"","Line of Business":{"code":"LOB57","label":"Power"}}]


