News
Abstract
Here are some steps to take if you are not seeing the System Monitor graphs as expected. If you see an empty chart, aren't seeing data you expect to be available, or get an Error such as: "Performance data is not available. Make sure performance collection is running. Wait a moment and retry this function."
Content
- Make sure that Collection Services is Started:

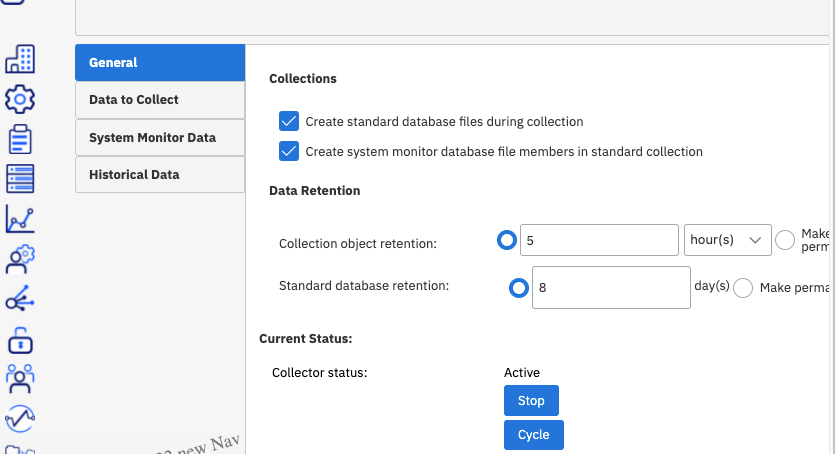
- Make sure you have enabled System Monitoring in Collection Services:

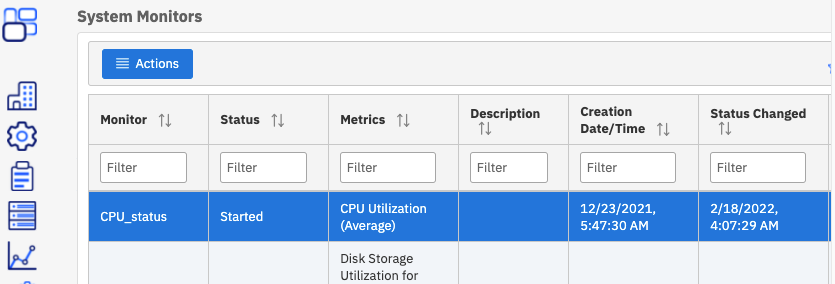
- Verify the monitor you want is in "Started" status:
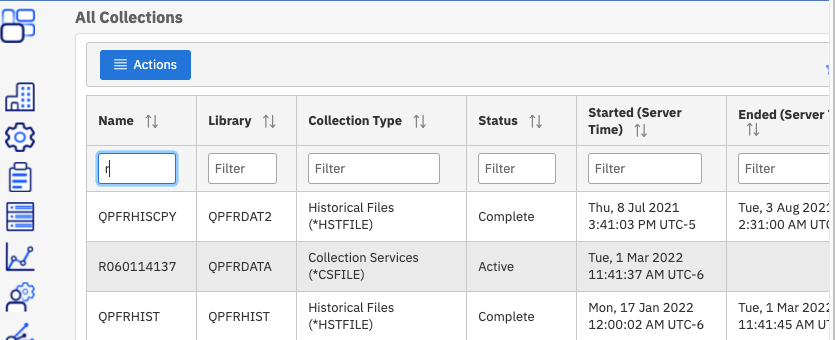
- Check that there is an active system monitor collection. Only one collection that starts with 'R' should be in active status.
- If there is not an active Monitor collection file, Cycle collection services:
- Verify that you are up to date on the latest Navigator and Group PTFs. Also note that when you apply new PTFs, the cover letter specifies the Steps to properly Apply the Navigator for i PTFs including stopping the MONITOR :
- Using the GUI, follow these steps to Stop Monitor Server
- Using command line: CALL PGM(QSYSDIR/QINAVMNSRV) PARM(*STOP)
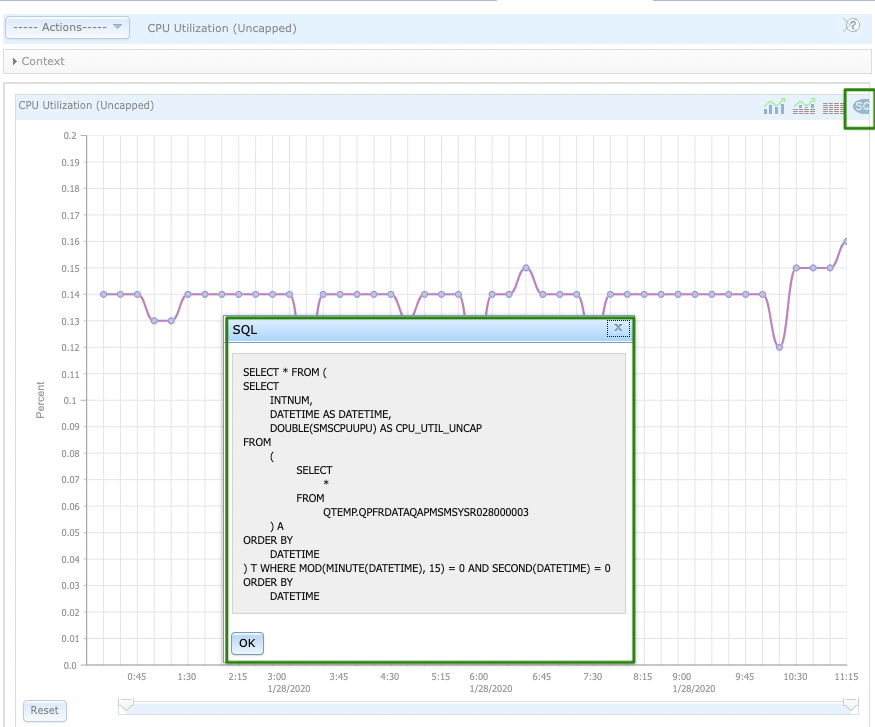
- If you are not able to see any charts or the charts are empty when you use Visualize Monitor Data, try using Performance Data Investigator to view one metric:
- Verify that the Collection Services database files required for the view exist.
- Use ShowSQL to view the query and use that in RunSQLScripts for your own verification that the file exists:
- '01' - All disk units
- '02' - Disk units in the system ASP
- '03' - Disk units in user ASPs
- '04' - Disk units in Independent ASPs
- /QIBM/UserData/Os400/Navigator/config/MONITOR
- monitor.log
- stderrA.txt & stderrB.txt
- stdoutA.txt & stdoutB.txt
- DSPJOBLOG JOB(QINAVMNSRV) when active
- The joblog sent to spoolfile when QNAMNSRV is more useful, particularly if it ends abnormally.
- Verify the job description for QNAVMNSRV has the correct message logging configuration: CHGJOB LOG(4 0 *NOLIST)
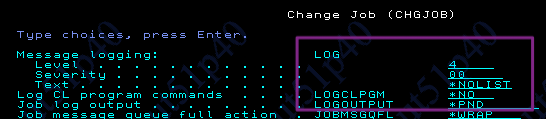
- On Navigator for i, it would look like this:
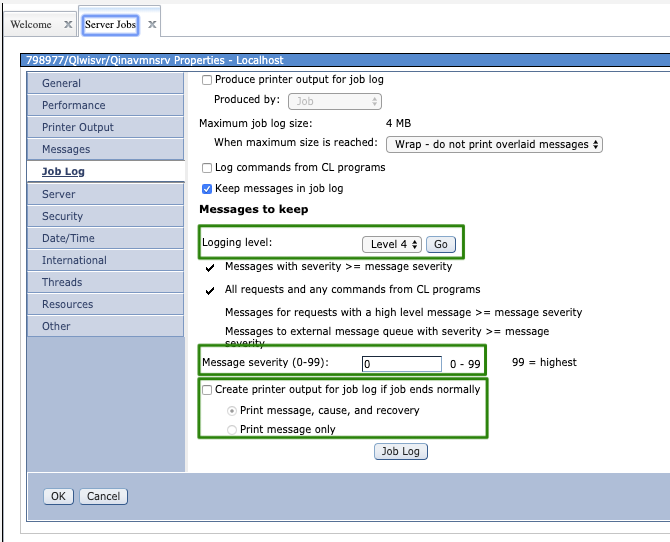
- "Create printer output for job log if job ends normally" UNCHECKED == LOG(x y *NOLIST) - If the job ends normally, no job log is produced. If the job ends abnormally a job log is produced.
-
CHECKED has radio button options:
-
Print message, cause, and recovery CHECKED == LOG(x y *SECLVL) - Both the message text and the message help (cause and recovery) of the error message are written to the job log.
-
Print message only radio button ON == LOG(x y *MSG)
-
-
/QIBM/UserData/OS/AdminInst/admin1/wlp/usr/servers/admin1/logs
-
messages.log
-
All of the regular log files can be gathered and sent in to service with the QMGTOOLS HTTP Admin collector:
Was this topic helpful?
Document Information
Modified date:
01 March 2022
UID
ibm11163782