News
Abstract
Dashboard provides a quick, live single-panel view of select system metrics in IBM Navigator for i.
This is for the heritage version of the dashboard.
For the new version of IBM Navigator for i dashboard, see: https://www.ibm.com/support/pages/node/6483563
Content
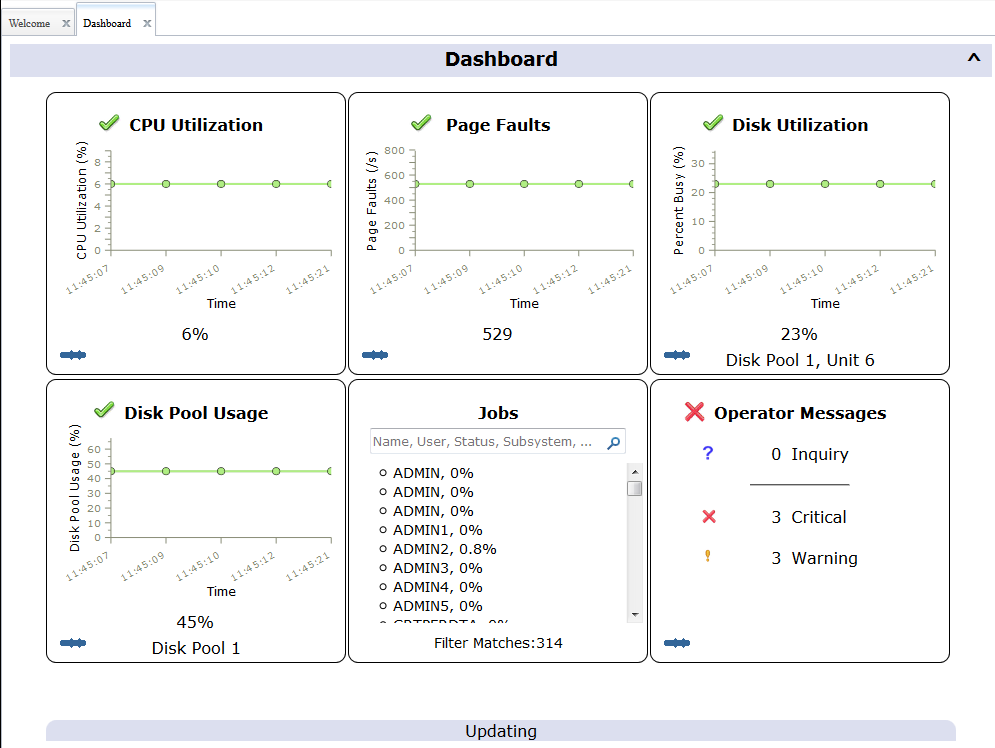
The Dashboard now replaces the Welcome page as the default panel when you start IBM Navigator for i.
The 6 metrics shown are:
- CPU Utilization (%)
- Page Faults (per second)
- Disk Utilization - % Busy
- Disk Pool Usage - % Full
- Jobs List
- Operator Messages
Threshold
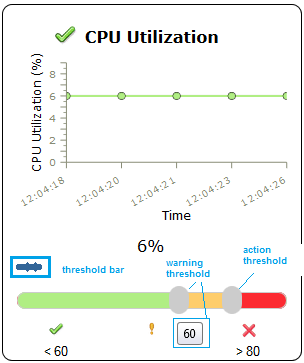
Hover over the grey oval for warning and action to see the tooltip values.
Move the threshold values by grabbing with a left mouse click and sliding to desired value.
More Detail
Each panel will provide more detail background information by left clicking on the chart.
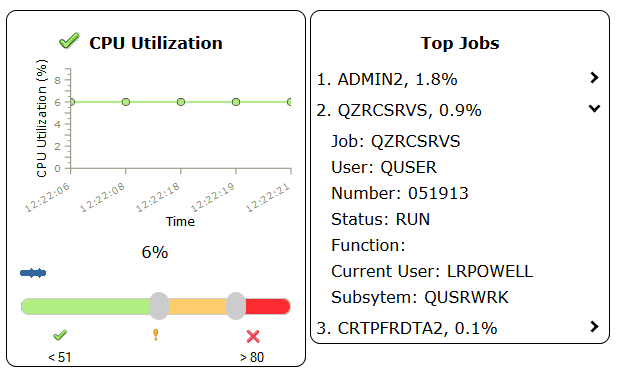
Click again to close the detail information and go back to the full dashboard.
Refresh and Interval Settings
Click on the Dashboard title bar twistie to open the options:

Refresh
Defaults to Auto. Click on the setting to switch between Auto & Manual Refresh.
When Auto refresh is selected, you can Stop & Start the dashboard from gathering and reporting new data.
When Manual refresh is selected, you can select the Refresh button to gather and report new data.
Interval and Duration
There are two configurable settings for the timing on gathering and reporting of data.
- Interval is the Sample Interval : The frequency at which a snapshot of system activity is reported.
- Duration is the Sample Length : The length of time data is collected during the interval.
You can obtain periodic snapshots by making the Duration smaller than the Interval.
You can obtain behavior similar to WRKSYSSTS by making Duration and Interval the same.
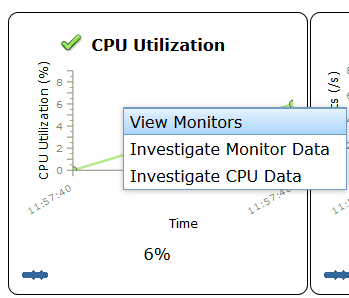
Launch to PDI and System Monitors
By right clicking on a chart, you will get Actions available to launch into Performance Data Investigator (PDI) and System Monitors. Depending on data available and which metric you are clicking on, you will get different options and perspectives (charts) to choose from:
Was this topic helpful?
Document Information
Modified date:
08 September 2021
UID
ibm11142860