News
Abstract
New features first added in 7.3
Content
The following new features were added with 7.3.
-
Dashboard status page
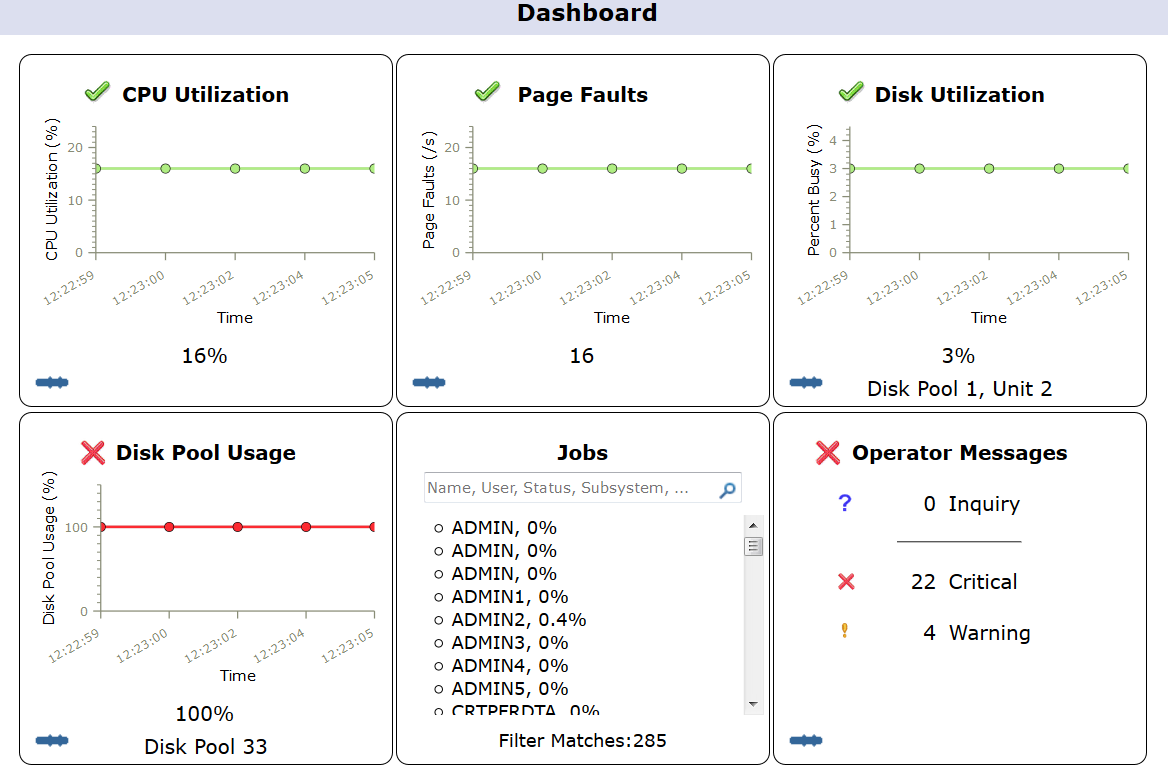
A new "dashboard" type status page now appears when IBM Navigator for i is accessed. It appears instead of the Welcome Page. The Welcome Page still exists, but is not shown by default as before. The dashboard status page shows a quick view of the current status items for your IBM i:-
CPU Utilization
-
Page Faults
-
Disk Utilization
-
Disk Pool Usage
-
Jobs
-
Operator Messages
-
For more information on this, see the Dashboard page.
-
-
-
Authority Collection for a User
The key reason behind this enhancement is to provide tooling to collect authority information that allows a customer to "lock down" security on their objects. There is often excessive authority today on many customer systems, and many customers are hesitant to change the object level authority in fear of breaking an application. With this enhancement, we provide the support that will allow the customer to trace/collect authority lookups over a period of time, have the system capture the data, and then the customer (or ISV) can analyze the data after it has been captured. This support will allow the customer to better secure their objects with the appropriate level of authority, as they will now have the authority data needed to make the object level authority changes. This support will give the system administrator the infrastructure support needed to make informed decisions related to changing authority.
To support this new feature, the following areas of the Navigator for i application have been updated for V7R3:
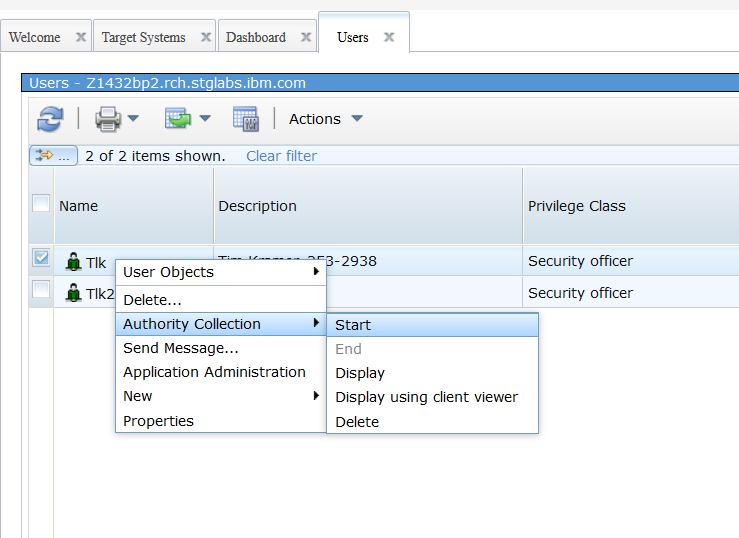
- New nodes in the console navigation area for starting, ending, displaying, and deleting authority collection for a user.
- New tasks available for a user within the User list to start, end, display, and delete authority collection.
- A new Authority Collection tab on the Capabilities page of the User properties panel that shows the current authority collection status for the user.
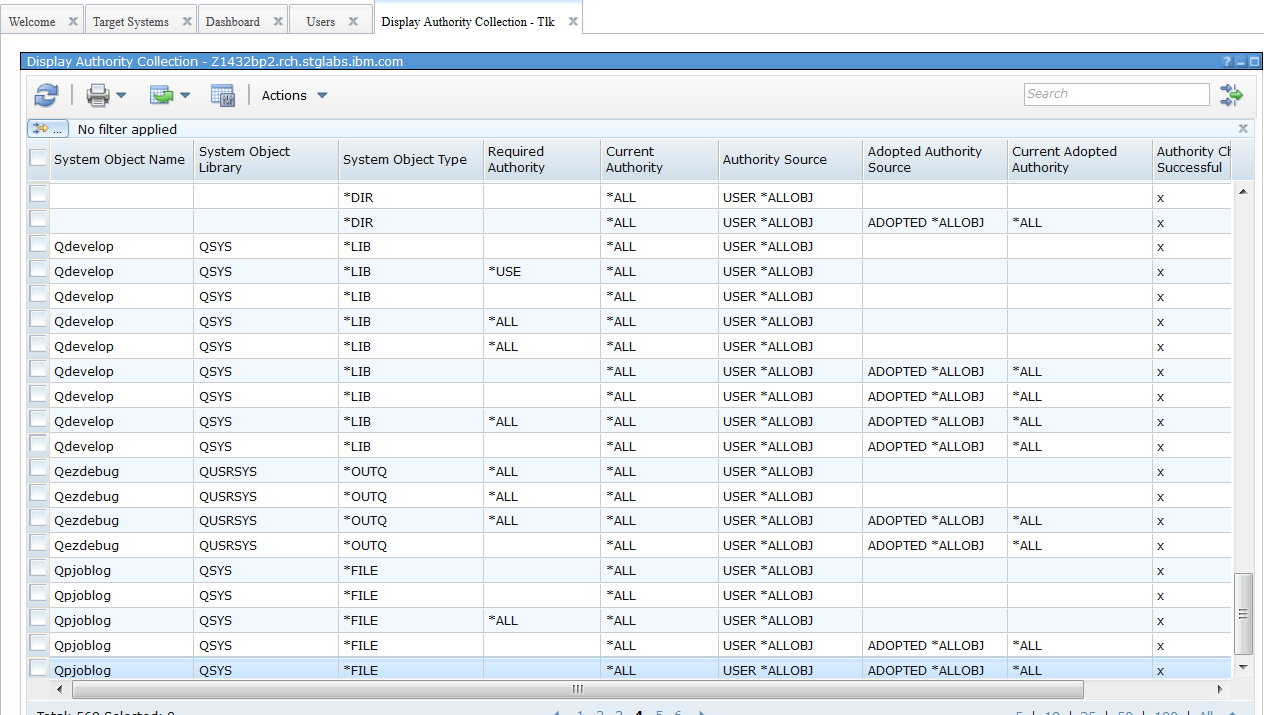
- A new table view of the items included in the authority collection. This can be viewed in a web table, or in a new client viewer if IBM i Access Client Solutions (ACS) is installed on the PC. The web table will also support Properties and Permissions actions for each object that appears in the list.
- Display PTF Apply Information
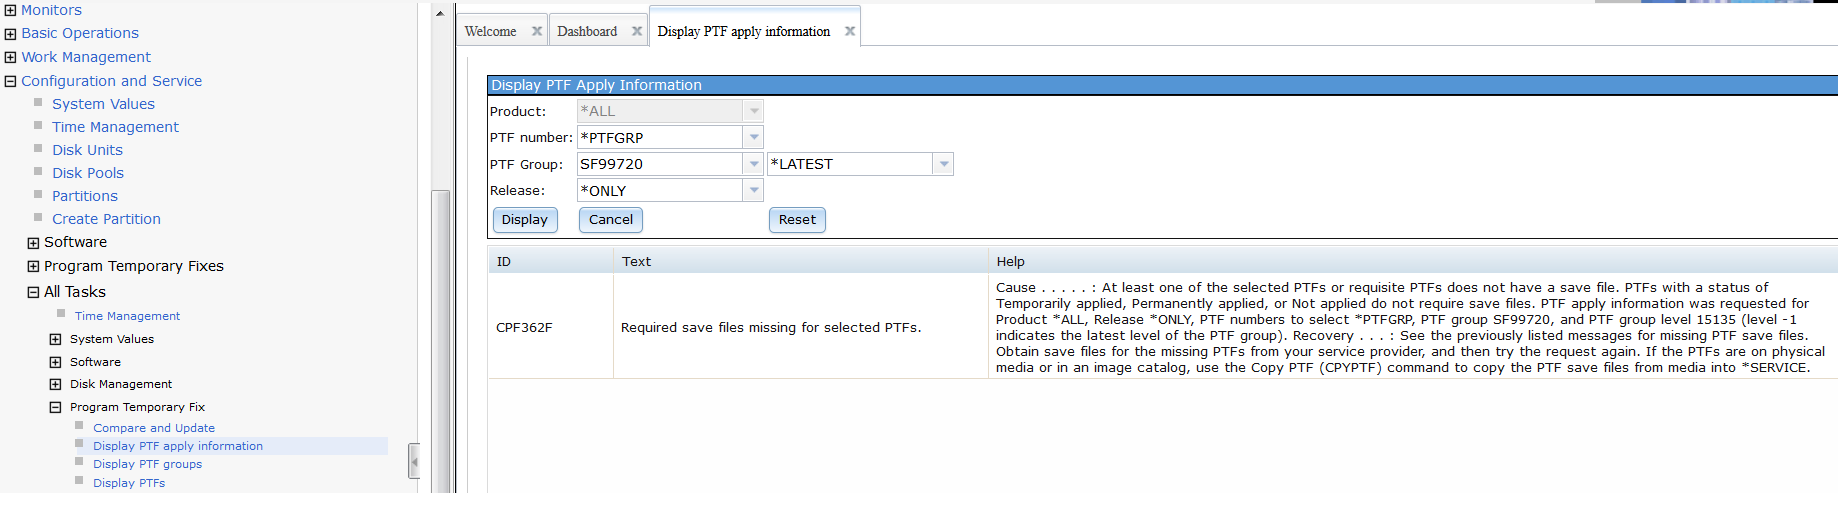
A new task has been added that provides a graphical user interface in Navigator for i for the DSPPTFAPYI (Display PTF Apply Information) command. This allows the user to display if a set of PTFs or a PTF group can be installed immediately or not. This task can be accessed from the All Tasks list shown under the Configuration and Service node.
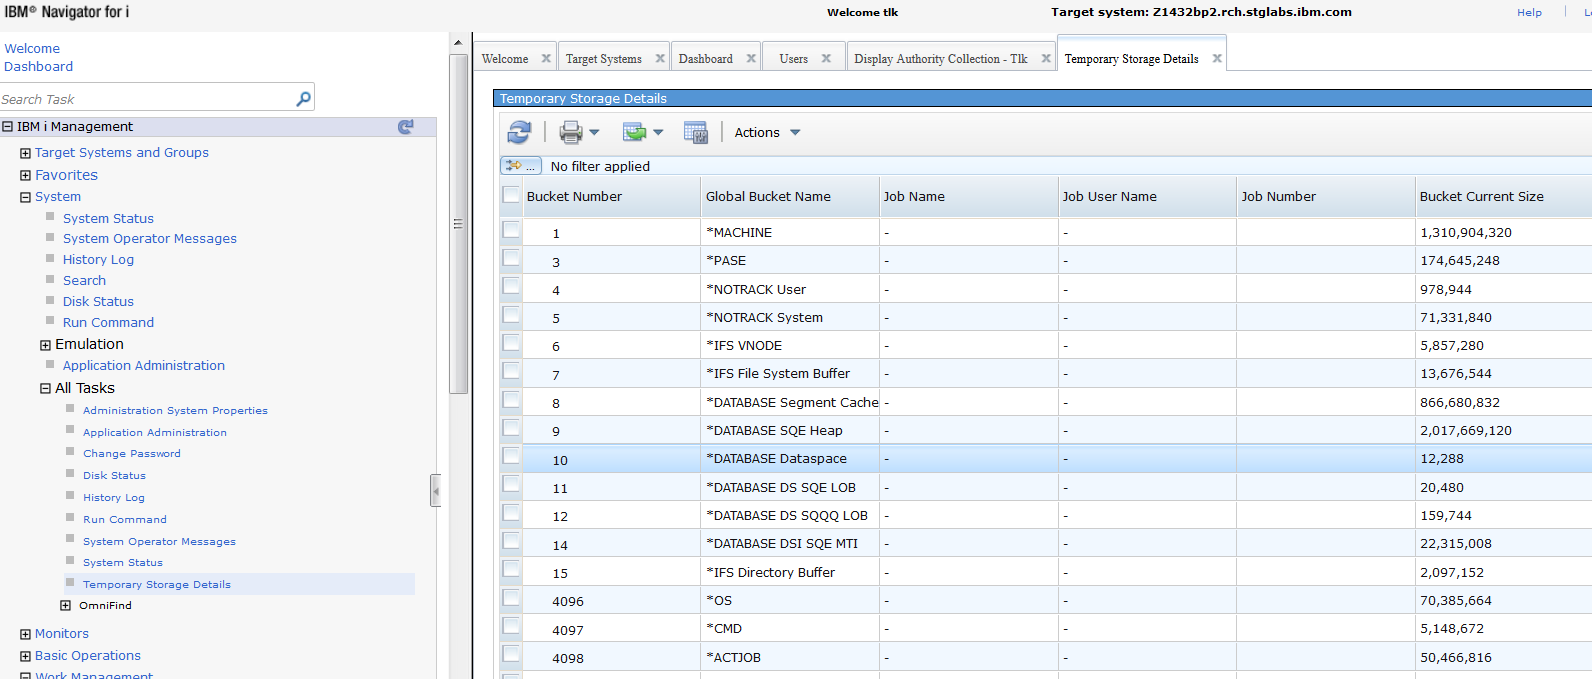
- Temporary Storage Details
A new task has been added in the All Tasks area under the System node, to display the temporary storage details for your IBM i server.
- Launching to IBM i Access Client Solutions (ACS) to display certain large lists
If you have IBM i Access Client Solutions (ACS) installed on your PC and listening for messages for the selected IBM i, IBM Navigator for i will now launch to ACS directly when you select to work with certain lists within Navigator for i. Examples:
- Run SQL Scripts
- Display Authority Collection results for a user
- System Monitor enhancement to support all metrics
The following items are part of system monitor stage 2 support:
|
- Double Click on IFS folder now supported to quickly open that folder
Now you can simply double click on a folder while working within the IFS in Navigator for i to open that folder and display it's contents in a separate tab.
- Connection Status now supported for SNTP Server
A 'Connection Status' action is now available for the SNTP (Simply Network Time Protocol) server. This server is displayed under Network --> Servers --> TCP/IP Servers ...
- Support for additional Auditing system value options
New auditing options *NETUDP, *NETSECURE, and *NETTELSVR for the QAUDLVL system value are now supported for Auditing System Values in Navigator for i under Configuration and Service --> System Values --> Auditing.
These three new options appear as 'User Datagram Protocol (UDP) traffic, Secure network connections, and Telnet Server connections in the 'Available actions' list (shown below).
- Tape Device support added
The tape support that was available within the System i Navigator windows application have now been made available on Navigator for i on the web. These new tasks are available under Configuration and Service --> All Tasks --> Tape Devices ...
- System-period temporal tables can now be established and managed via IBM Navigator for i Database
New IBM® Db2® temporal data management technology enables companies to track and query historical, current, and future conditions in a straightforward and efficient manner. The result is a simpler way to implement auditing and compliance initiatives, to pinpoint and correct human errors, to ensure the integrity of data over time, and to assess changing business conditions.
-
Graph History: Utilize the new historical data collection available from Collection Services with the IBM Navigator for i Graph History function to visualize data over days, weeks, months and years. The performance task Summary charts provide an easy to manipulate graph which allows you to view metrics over time and drill down into top contributors for an interval.
-
Visualize Monitor Data (System Monitor): New charting for monitors allows you to view all the metrics for one monitor on one page. This easy to use panel provides a context panel with options for layout, show threshold, etc.
- Performance updates for 7.3
Was this topic helpful?
Document Information
Modified date:
21 January 2020
UID
ibm11142848