News
Abstract
Disk Reads and Writes Detail
Content
This perspective contains interval measurements for Disk Storage Systems.
Four views:
- Performance Data Investigator IBM i Model DSS
- Read/Write Rate and Response Time
- Read/Write Transfer Size and Rate
- Installed Disk Hardware
1. IBM i Model DSS
This table provides details on the disk reads & writes by interval. This table can be exported to a .csv file using the Export action. Select "All data" to export all intervals.
The column titles and format is provided for Intellimagic Disk Magic
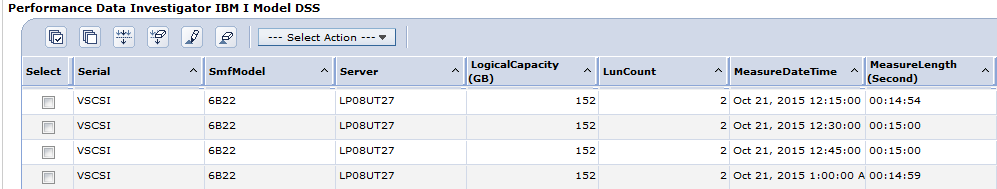
Following columns:
- Serial=Serial Number - Unique name for this DSS
- SmfModel=Disk Unit Model - Hardware model for this DSS
- Server - Server name
- LogicalCapacity = Disk Capacity - Total Used Capacity in GB by this server.
- LunCount - Lun count for this server
- MeasureDateTime = Interval Date and Time - Start of the measurement interval in the format yyyy/mm/dd hh:mm:ss
- MeasureLength = Elapsed Interval Seconds - Length of the measurement interval in the format hh:mm:ss
- ReadRate = Read Rate (Seconds) - Average number of Total Read Operations per second
- WriteRate = Write Rate (Seconds) - Average number of Total Write Operations per second
- Read Transfer Size - Average Transfer size of Read Operations in KB (=1024 bytes)
- Write Transfer Size - Average Transfer size of Write Operations in KB (=1024 bytes)
- ReadResp = Average Read Response Time (milliseconds)
- WriteResp = Average Write Response Time (milliseconds)
- WaitTime - Average wait time in ms
- Read Hit - Fraction of Read Operations that were handled in the cache storage.
- Controlled Read Hit - Controller Read Hit fraction (for iSeriesInternal)
- Write Efficiency - The number of times a track is written to before being destaged to disk.
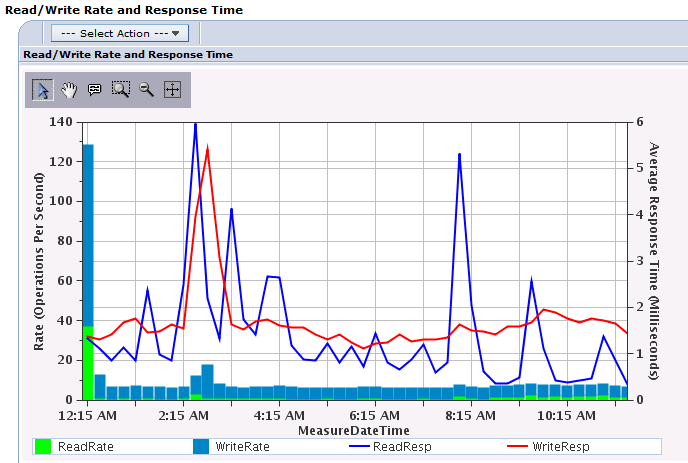
2. Read/Write Rate and Response Time
This chart is disk rate and response times. Read rate and write rate are shown as bars. Average read response time and average write response time are shown as lines.
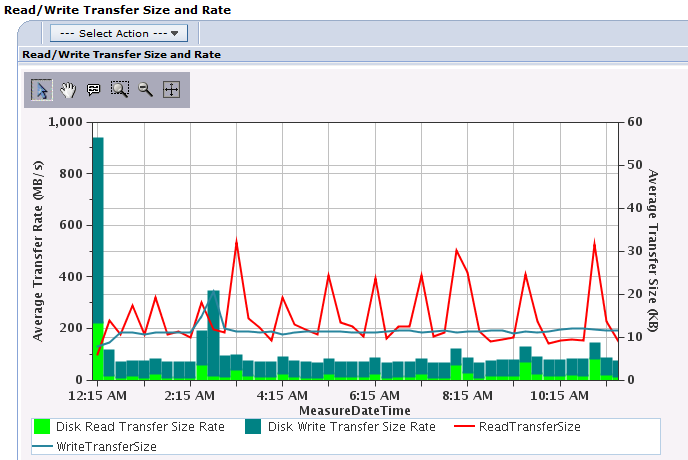
3. Read/Write Transfer Size and Rate
This chart shows transfer size versus read rate. Read transfer size and write transfer size are shown as bars. Read rate and write rate are shown as lines on the chart.
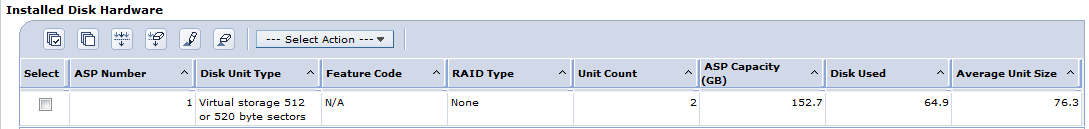
4. Installed Disk Hardware
This table provides installed disk hardware information: ASP number, Disk unit type, Feature code, RAID type, Disk unit count, APS capacity, Disk used %, and Average unit size.
Was this topic helpful?
Document Information
Modified date:
20 January 2020
UID
ibm11127913