News
Abstract
System Monitor Metrics vs Collection Service System Monitor Categories
Content
System monitoring on IBM i encompasses two aspects for the metrics. The first is the data collected (metrics) and the second is thresholds and actions for those metrics that can be defined.
- The collection of system monitoring data metrics can be done in two ways:
- Collection Services System Monitor Categories
- One is within collection services, by configuration under the System Monitoring Data tab. The System Monitor categories added cause the metrics to be collected at smaller system monitoring levels, and create the unique system monitoring collection (R*) and collection files (QAPMSM*).
- Some metrics are available here that are not available under System Monitors:
- IBM Domino for i - *DOMINO
- File QAPMDOMINO
- WebSphere Application Server - *WAS
- IBM Domino for i - *DOMINO
- QHTTP - *HTTP is added to System Monitors, so is listed in both locations
- Note: All three of these three categories are unique, because they are only collected if the products are installed on the partition in order for the data in these categories to be collected.
- If the collection services configuration objects are ever manually rebuilt (by renaming and calling QYPSCOLDTA), these special categories are not added back. The categories are normally added by install-exit programs owned by the product that will register and deregister the categories within Collection Services.
- System Monitor Metrics Selected
- The other method is within IBM Navigator for i System Monitor function by creating a system monitory, selecting metrics to be monitored, and starting that system monitor.
- Collection Services System Monitor Categories
This page describes the difference in the system monitor data collection aspect when done with either Collection Services support or the System Monitor function.
Collection Services support for System Monitors
The collection services configuration supports the concept of system monitoring. To enable this, set the "Create System Monitor Collection" on the System Monitor Data tab. On the heritage version, this was called, "Enable system monitoring" option within Configure Collection Services.
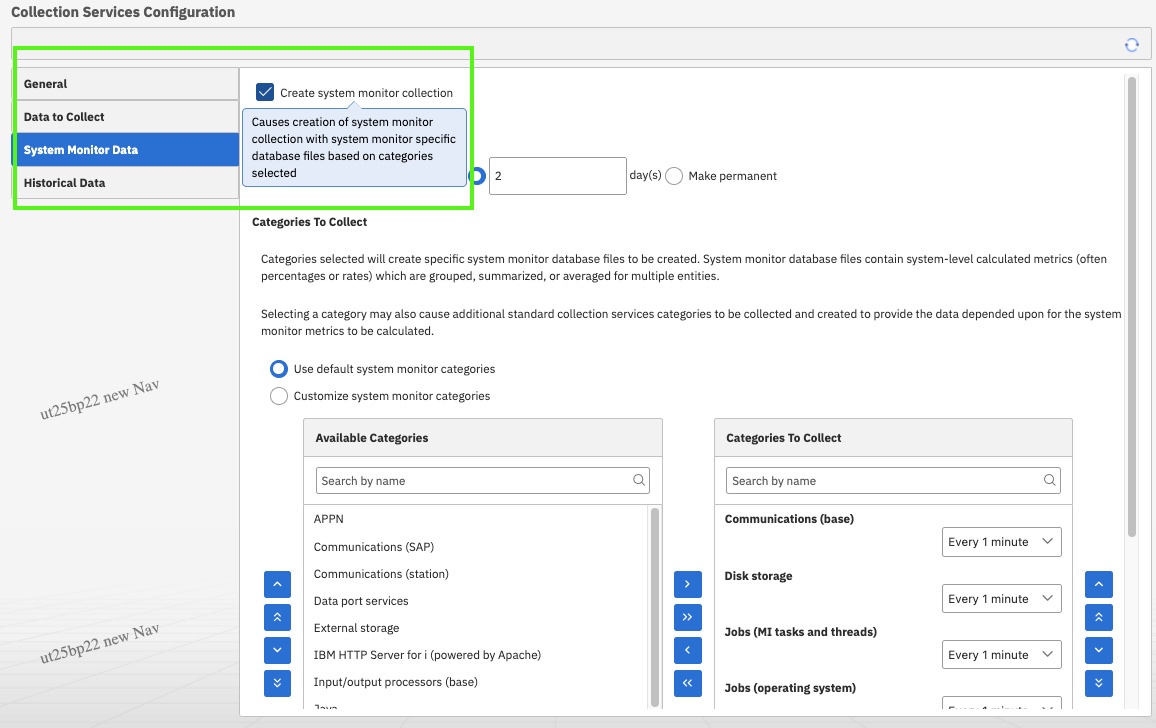
With the system monitor collection enabled, the collector gathers configured categories at a default or specified system monitoring interval.
Once cycled, the collector then create another collection based on the *MGTCOL name except that the name begins with "R" rather than "Q".
Some metrics collected by category are in the same files as they are found for collections services. Other metrics, which are derived and calculated specifically for system monitoring, are placed in specific files just for system monitors, named with the prefix, "QAPMSM".
System Monitor Categories
The categories available are listed next. When system monitoring is turned on for Collection Services, the default categories are collected at one minute intervals. Those descriptions marked with '*' and bold in the table are ON by default.
The default and asterisked categories have specific derived metrics that are put into the QAPMSM* files as listed under primary files. For the categories that support QAPMSM* files, these metrics are unique from what would be collected in a regular Collection Services collection.
Other categories cause the same metrics collected as are already saved today for Collection Services, but with potential for collecting at smaller intervals. The only difference when collecting metrics within the System Monitor categories those same metrics that aren't put in specific QAPMSM* files, is that the time-interval can be specified separately from what is collected for the Q* collections.
| Category |
Description |
Primary files |
|
*APPN |
APPN |
QAPMAPPN |
|
*CMNBASE |
Communications (base)* |
QAPMSMCMN QAPMASYN QAPMBSC QAPMDDI QAPMECL QAPMETH QAPMFRLY QAPMHDLC QAPMIDLC QAPMLAPD QAPMPPP QAPMX25 |
|
*CMNSTN |
Communications (station) |
QAPMSTND QAPMSTNE QAPMSTNL QAPMSTNY |
|
*CMNSAP |
Communications (SAP) |
QAPMSAP |
|
*DOMINO |
IBM Domino for i |
QAPMDOMINO |
|
*DPS |
Data port services |
QAPMDPS |
|
*DISK |
Disk storage* |
QAPMSMDSK QAPMDISK QAPMDISKRB QAPMXSTGV |
|
*EXTSTG |
External storage |
QAPMXSTGD |
|
*HTTP |
IBM HTTP Server for i (powered by Apache) |
QAPMHTTPB QAPMHTTPD |
|
*IPCS |
Input/output processors (base) |
QAPMIOPD QAPMTSK |
|
*TCPIFC |
Network server |
QAPMTCPIFC |
|
*JAVA |
Java™ |
QAPMJVM |
|
*JOBMI |
Jobs (MI tasks and threads)* |
QAPMSMJMI QAPMJOBMI QAPMJOBWT QAPMJOBWTD QAPMJSUM |
|
*JOBOS |
Jobs (operating system)* |
QAPMSMJOS QAPMJOBOS QAPMJSUM QAPMJOBSR |
|
*LCLRSP |
Local response time |
QAPMRESP |
|
*LPAR |
Logical partition |
QAPMLPARH |
|
*POOL |
Memory pool* |
QAPMSMPOL QAPMPOOLB |
|
*POOLTUNE |
Memory pool tuning |
QAPMPOOLT |
|
*RMVSTG |
Removable storage |
QAPMTAPE |
|
*SNA |
SNA |
QAPMSNA |
|
*SNADS |
SNADS |
QAPMSNADS |
|
*SYSBUS |
System bus |
QAPMBUS QAPMBUSINT |
|
*SYSCPU |
System CPU |
QAPMSYSCPU QAPMSYSPRC QAPMSYSAFN |
|
*SYSLVL |
System-level data* |
QAPMSMSYS QAPMSYSTEM QAPMSHRMP QAPMSYSWLC |
|
*SYSINT |
System internal data |
QAPMSYSINT |
|
*SQL |
SQL |
QAPMSQL |
|
*TCPBASE |
TCP/IP (base, interface) |
QAPMTCP |
|
*USRTNS |
User-defined transaction data |
QAPMUSRTNS |
|
*WAS |
WebSphere Application server |
You can read more about these categories in IBM Docs: https://www.ibm.com/docs/en/i/7.4?topic=csdf-collection-services-data-files-system-category-file-relationships
Some of the specific system-monitor supported metrics are derived. Derived indicates that the metrics are calculated by being grouped, summarized, or averaged from other collected metrics. Derived metrics are unique from the collection services metrics (put in the QAPM* files). These derived metrics are put into QAPMSM* files.
System Monitor Metrics in IBM Navigator for i
Using the System Monitors support, you can collect system monitor supported metrics and also set thresholds and actions to be taken based on the values of these metrics. System Monitor specific metrics that can be collected are listed when you add or modify a system monitor when you specify Monitor-> System on IBM Navigator for i. Monitor metrics are the derived metrics that are collected into the QAPMSM* files as well as others that are also collected in the same manner for a regular collection services collection. The HTTP metrics are an example of the non-derived metrics. Within the IBM Navigator for i function, not all categories or metrics are supported to be monitors.
- Communications Line Utilization (Average, Maximum)
- LAN Utilization (Average, Maximum)
- Disk Response Time (Read, Write)
- Disk Arm Utilization (Average, Maximum)
- Disk Storage Utilization (Average, Maximum)
- Disk Arm Utilization for System ASP (Average, Maximum)
- Disk Storage Utilization for System ASP (Average, Maximum)
- Disk Arm Utilization for User ASP (Average, Maximum)
- Disk Storage Utilization for User ASP (Average, Maximum)
- Disk Arm Utilization for Independent ASP (Average, Maximum)
- Disk Storage Utilization for Independent ASP (Average, Maximum)
- CPU Utilization (Average, SQL, Interactive Jobs, Uncapped)
- Batch Logical Database I/O Rate
- Interactive Response Time (Average, Maximum)
- Transaction Rate (Interactive)
- Spool File Creation Rate
- Machine Pool Faults Rate
- User Pool Faults Rate (Average, Maximum)
- Shared Processor Pool Utilization (Physical, Virtual)
- Temporary Storage Utilization
- HTTP Requests Received (Rate, Maximum)
- HTTP Responses Sent (Rate, Maximum)
- HTTP Non-Cached Requests Processed (Average, Maximum)
- HTTP Error Responses Sent (Average, Maximum)
- HTTP Non Cached Requests Processing (Time, Highest Average Time)
- HTTP Cached Requests Processing (Time, Highest Average Time)
Description for each metric is provided here in IBM Docs: https://www.ibm.com/docs/en/i/7.4?topic=monitor-metrics
Was this topic helpful?
Document Information
Modified date:
02 December 2021
UID
ibm11127007