News
Abstract
The graph history stacked chart view is an interactive way to compare data from multiple days, weeks or years. This function redistributes the data to multiple data series so that data from the same time, day or week can be compared.
Content
Graph History - stacked charts
- The graph history stacked chart view is an interactive way to compare data from multiple days, weeks or years.
- This function redistributes the data to multiple data series so that data from the same time, day or week can be compared.
- The stacked chart view displays a single metric to be "stacked" or displayed on one chart with each segment of time displayed as a separate line on the y-axis.
- Provides multiple days' performance data to easily be compared across time to identify trends or hot spots.
- Stacked charts are available on the Summary (single metric) charts
- Stacking by day, week or month allows comparison of performance data and how it is changing.
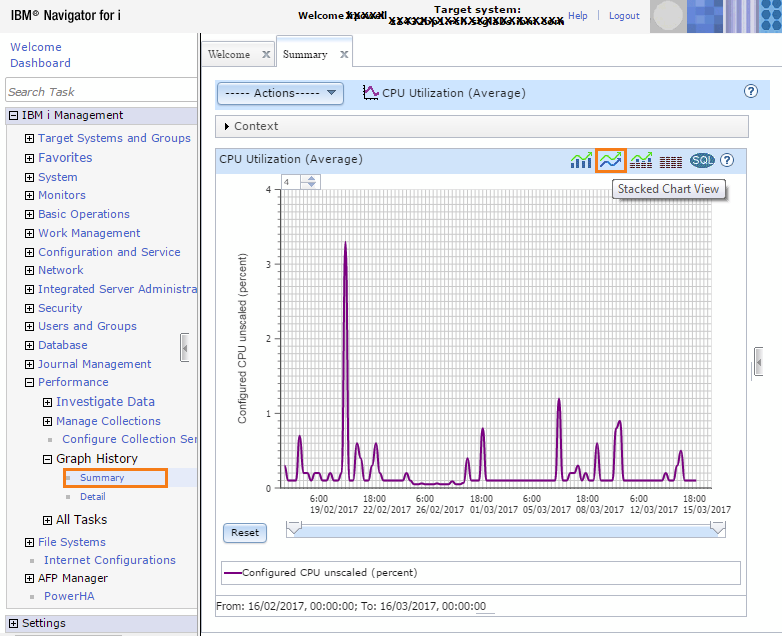
To use the stacked chart function, launch a Summary chart from Performance -> Graph History. Then select the Stacked Chart View icon:
Stacking
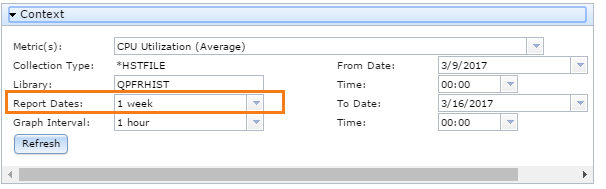
The data used for stacking is based on what was specified in the context section for report dates.
How the chart is stacked is determined by how many days’ historical data the users want to display. This can be configured by the “Report Dates” or “From Date” and “To Date” in the context section.
Selecting the Stacked Chart View icon causes the chart to be redrawn in stacked mode.
- Stack by day is used when the historical data to be displayed is less than two weeks.
- Stack by week is used when the historical data to be displayed is from two weeks up to and including two months.
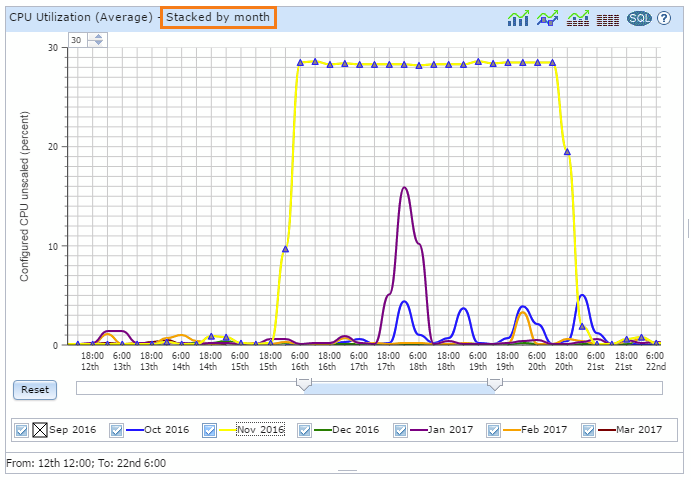
- Stack by month is used when the historical data to be displayed is greater than two months and less than two years.
- Stack by year is used when the historical data to be displayed is two years or more.

This chart is stacked by day. The original chart was one week which can be viewed in the context section (when opened). If custom was used, the stacking will be determined by the length of time between the from date and to date specified.
Each day has its own data series and is plotted with a different color line.
Hovering on the checkbox in the legend will highlight that metric on the chart.

The highlighting will only remain while the cursor is hovered over that metric checkbox.
Plot markers are provided in the stacked chart. When one data series is selected, the plot markers for that series are shown.
Plot markers are only available when the chart is zoomed in enough to provide room to display the plot markers.
For triangle and square plot markers, clicking on them launches the top contributors chart. Circle plot markers indicate that the top contributor data for that metric and interval are not available.
By clicking a data series checkbox, the data series can be removed or added to the chart.
How to show highlight and plot markers on the graph history stacked chart
Hovering over a check box in the legend provides 2 possible changes on the chart:
1) Charted line bold and brought to front: If there are too many points on the current view to display plot points, then the line for that metric is brought to the front and shown in bold. The bold disappears when moving the mouse away but the line remains in front of other lines on the chart.
2) Charted line plot markers displayed: If the charted values and size of displayed chart window allow, the line for that metric is brought to the front and the plot markers is displayed. The plot markers are only shown for one data series at one time. They stay displayed until the mouse is repositioned over the check box for this metric or the mouse is hovered over different metric check box. If the plot markers are not displayed, zooming in on the chart allows for plot markers to be displayed. As an indicator, markers are displayed on the stacked chart view icon (on upper right corner of chart) when the plot marker can be shown.
Graph History other details
- Our javascript code will follow the users browser locale to determine how the date will be formatted.
- There are a couple exceptions to this where it is out of PDI's control. One is with Chrome where the dojo Date fields don't always respect the format (en_GB for example). Another is with date strings at the caption headings on sections of the panel where DateFormat using getDateTimeInstance doesn't respect en_GB.
Was this topic helpful?
Document Information
Modified date:
20 January 2020
UID
ibm11126941