News
Abstract
Graph History support is available in the Performance task of IBM Navigator for i in 7.3 and later releases.
Content
- Graph History Overview article
- In-depth article: Graph History with PDI_0.pdf (attached here, the same article is also on web at: A New Way to Analyze Historical Performance Data).
- Support page Stacked Charts - learn how to stack the data for comparison by day, week, or month.
Graph History Function
Historical data support with Collection Services and graphical visualization of that data with Graph History in the Performance task of IBM Navigator for i is available on IBM i.
Historical data can help you identify trends and investigate past performance issues.
- A performance collection type *HSTFILE contains Historical Data as a file-based performance collection.
- In the Graph History window, you can see a graphical view of the metrics collected for an extended time by Collection Services.
Historical Data is the data collected by Collection Services and then reduced and summarized with the intent of keeping over a long time. The data is intended to be just a subset of the original Collection Services collected data.
To enable the concept of aging or decaying data, there are two levels of historical data – detail and summary. As you can see from this chart, as the maximum collection duration increases, the number of metrics available decreases.
|
Maximum duration of collection |
Number of metrics available (variety of data) |
|
|
Collection Services data in *CSFILE |
24 hours |
Most |
|
Historical Detail data in *HSTFILE |
60 days |
Fewer |
|
Historical Summary data in *HSTFILE |
50 years |
Least |
The Summary historical data is the system level or summarized metrics that are stored. These are useful in identifying trends or detecting changes in a system over a long period.
The Detail historical data is the data from which the summarized metrics are derived and other relevant supplementary data. This data is used to look deeper into a problem identified when analyzing the summary historical data. Only the top number of contributors for each metric are stored as historical detail data.
Graph History Summary charts
The Graph History function provides access to Collection Services historical performance data, both summary and detail. Historical summary data is the system level or summarized metrics that are useful in identifying trends or detecting changes in a system over a long time.
- Summary data can be kept for 1 month up to 50 years.
- Summary metrics are derived from detail performance data and other relevant supplementary data.
- Summary data is stored in database files beginning with QAPMHM*.
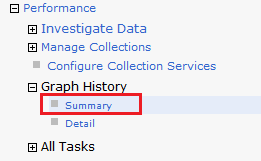
To view the historical data, there is a Graph History task section in Performance. To start, select “Summary” under Performance-> Graph History:

Context panel
The context panel is where you can view what data is being displayed and modify the metric, report dates, graph interval and more. After any changes to the context panel, click “Refresh” to get the changes reflected on the chart displayed.
The context section is closed any time the chart is displayed or updated to provide maximum charting space. To modify the metric, report dates or interval, open the Context section.
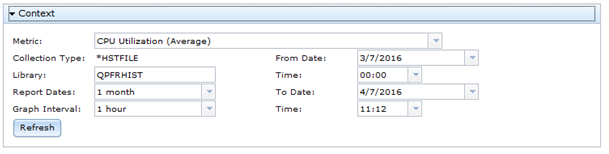
CPU Utilization (Average) is the first chart to be displayed. Select any metric from the drop-down to view the data for that metric.
Summary Metrics:
- Batch Logical Database I/O Rate
- CPU Utilization - Average, Interactive Jobs, SQL, Uncapped
- Communication Line Utilization – Average, Max
- Disk Arm Utilization – Average, Max
- Disk Arm Utilization for Independent ASPs – Average, maximum
- Disk Arm Utilization for System ASP – Average, maximum
- Disk Arm Utilization for User ASPs – Average, Maximum
- Disk Response Time – Read, Write
- Disk Storage Utilization – Average, Maximum
- Disk Storage Utilization for Independent ASPs – Average, Maximum
- Disk Storage Utilization for System ASP – Average, Maximum
- Disk Storage Utilization for User ASP – Average, Maximum
- Interactive Response Time – Average, Maximum
- Interactive Transaction Rate
- LAN Utilization – Average, Maximum
- Machine Pool Faults Rate
- Shared Processor Pool Utilization – Physical, Virtual
- Spool File Creation Rate
- Temporary Storage Utilization
- User Pool Faults Rate – Average, Maximum
The Report Dates field determines which dates are displayed on the graph. The Graph Interval values available are based on the Report Dates range. For a larger range of time, the graph interval is larger. For a smaller range of time, the graph intervals available is smaller. For example, if one month of data is requested, you are able to set the graph interval to 1-hour, 6 hours, 12 hours, or one day (24 hours). If a report date greater than one year is chosen, then the graph interval values available are one month or one year. Here are the Graph Interval settings available based on what report date range is selected:
|
Report Date (range of time selected) |
Graph Intervals available |
|
Today |
5 min, 15 min, 30 min, 1 hour |
|
1 week |
30 min, 1 hour, 6 hours, 12 hours |
|
1 month (default) |
1 hour, 6 hours, 12 hours, 1 day |
|
1 year |
6 hours, 12 hours, 1 day, 1 week, 1 month |
|
Custom < 6 hours |
5 min, 15 min, 30 min, View All Points |
|
Custom > 1 year |
1 month, 1 year |
Understanding the Graph History Summary chart
This chart is created for one metric over the specific time range selected in the context section. Each point on the graph is shown with a symbol and color, which indicates information about the data charted at that interval.
A Circle represents a data collection point that has historical summary data available. No detail data is available for this interval.
- A blue border around the circle indicates that the summary data is either collected* or aggregated**
- A white border around the circle indicates that the summary data is interpolated (or extended from the previous collected data point)***
A Square or Triangle both represent data collection points that also have historical detail data available. You can click the square or triangle to see the Top Contributors data for that interval. The top contributors chart is shown on the right side of the Graph History window.
- A Square represents either a collected* or interpolated (estimated at intermediate points that were not collected) data point***
- A blue border around the square indicates that the interval plotted is a collected data point. The value charted can be found in the historical database file.
- A white border around the square means that the interval plotted is an interpolated data point (estimated at intermediate points that do not have collected data). This value matches the one to the left and was needed to provide integrity to the chart for the graph interval requested.
- A Triangle represents an aggregated** data point.
* Collected means that the value charted was taken from a historical database file.
**Aggregated means that the value charted is calculated from multiple intervals in the historical database files.
For example, if data is collected at 15 minute intervals and the chart is showing 1 hour graph intervals, the data point is an aggregate of 4 time intervals combined.
***Interpolated (or Extended) means that the value charted for that time interval is not available in the historical database file (i.e. not collected). The data at this intermediate point is estimated from the previous interval value.
For example, if we have data collected at 30 minute intervals and the chart is showing 5 minute graph intervals, we need to show something for the intervals that are not available. The data points between the collected intervals are interpolated by extending the value from the previous collected interval.
Was this topic helpful?
Document Information
Modified date:
04 October 2021
UID
ibm11126935