Flashes (Alerts)
Abstract
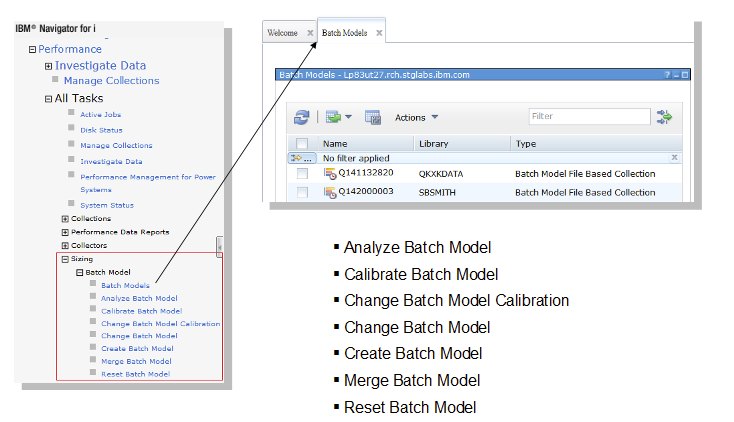
The Batch Model set of commands is available under Sizing as part of the Performance task.
Content
The Batch Model tool models the system utilization and job run times of IBM i batch workloads. You can use the Batch Model commands to help analyze and predict batch job performance on the IBM i and help answer the question: “What can I do to my system in order to meet my overnight batch run-time requirements (also known as the batch window)?” A Batch Model collection is created based upon existing performance data collected using IBM i Collection Services. The batch model file based collections can be viewed and managed with other collections in the Collection Manager table.
See also the Developer Works Article: How to Use Batch Model
Batch Model
- A tool based on Collection Services performance data that predicts batch workload run times, resources used, and duration of the “batch window”.
- Batch performance is important for many customers
- "What can I do to my system in order to meet my overnight batch run-time requirements? (also known as the Batch Window) "
What does it do?
- Helps you optimize workloads by locating times during the batch window when more efficient job scheduling can improve total system throughput
- Models workload increases
- Predicts the changes in throughput that will result from hardware upgrades (processor or disk)
- Predicts run times for individual workloads and the overall batch window
- Models batch workloads that are CPU or disk intensive
How does it work?
- Links individual workloads together to create an ordered series of workloads
- Powered by an iterative analytic model that attempts to converge on a solution
- Predicts utilization, throughput and response time for each workload
Function under Performance task in IBM Navigator for i
This feature requires 5770PT1 option 1 - manager feature - to be installed on your system i
PDI Package for Batch Model
Measured/Modeled Workload Timeline Overview
This chart shows the sequence that each workload runs and provides a clear picture of the time window for both the measured and modeled workloads.
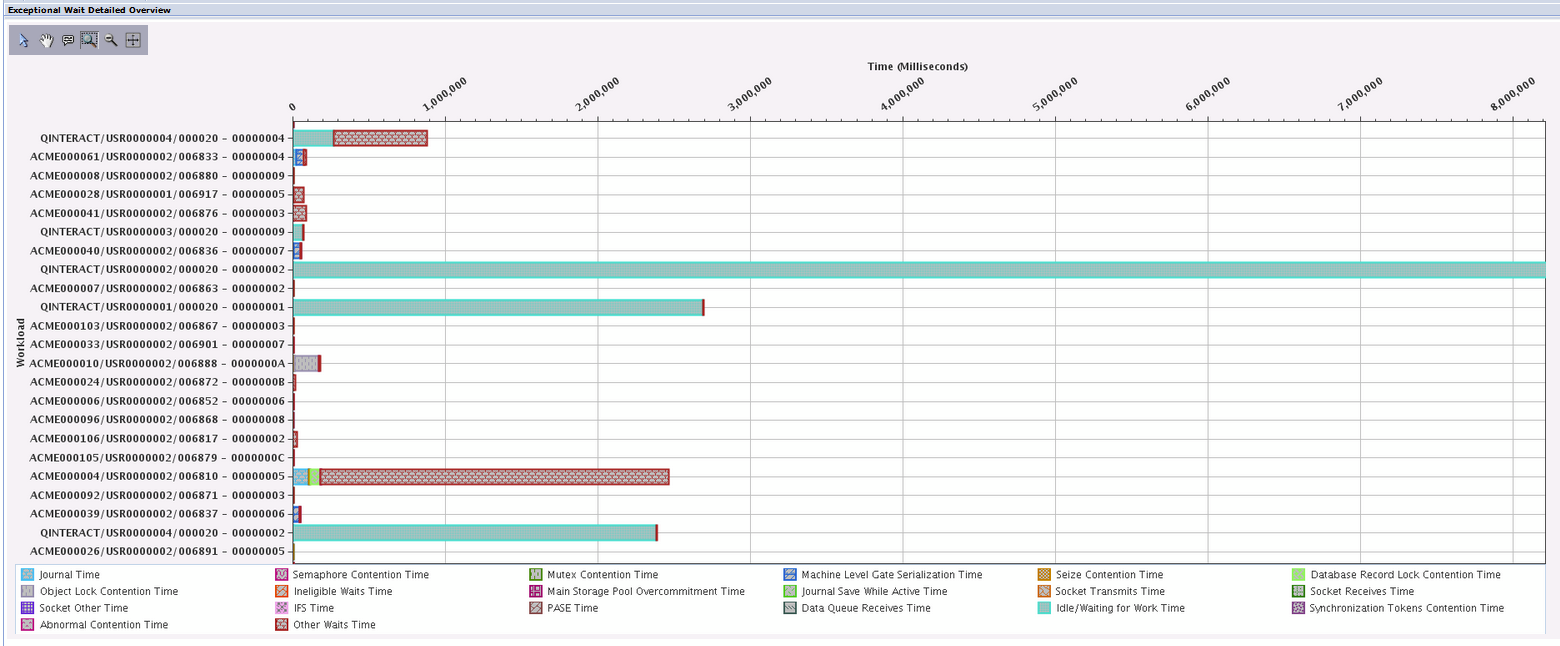
Exceptional Wait Detailed Overview
Investigate the waits that make up the "exceptional wait" time
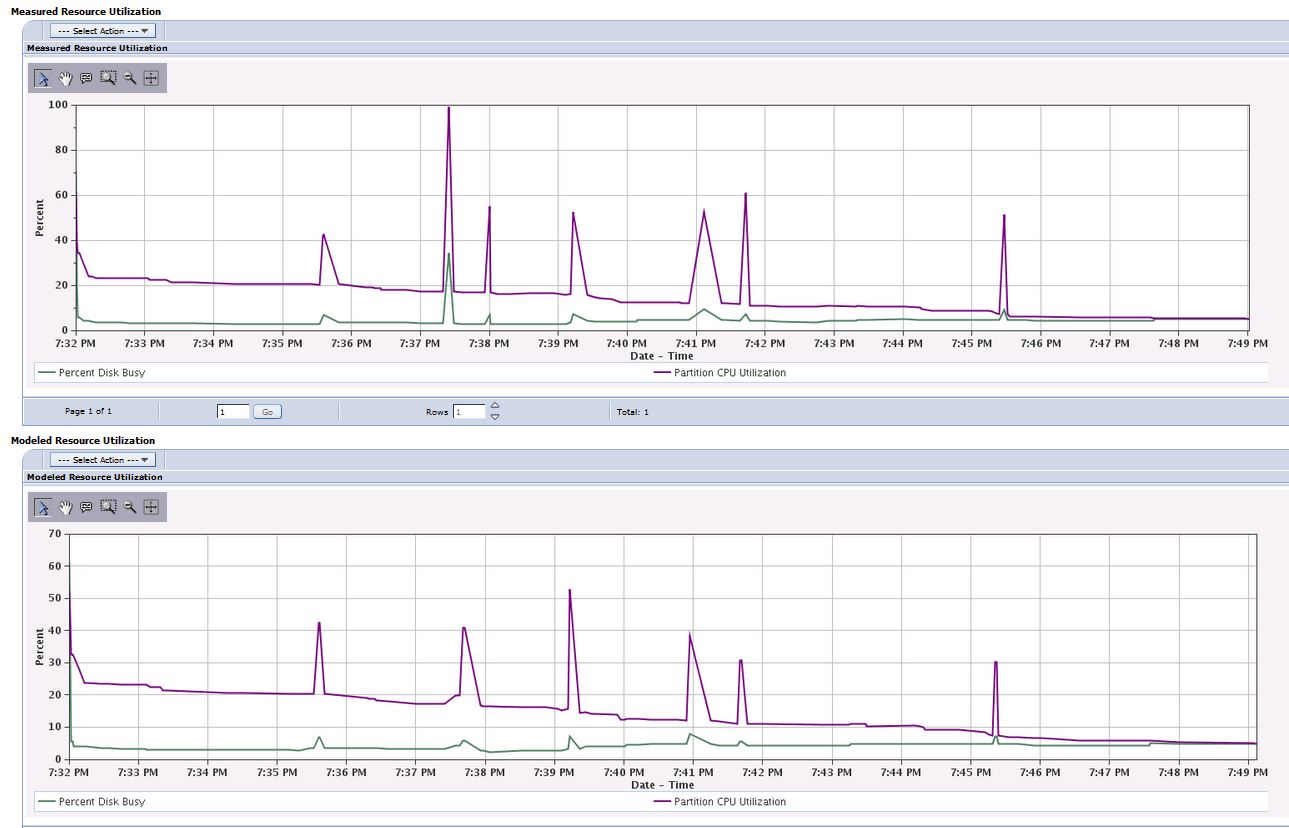
Measured vs. Modeled Resource Utilization Overview
This chart shows the resource utilization percentage of the measured and modeled batch window.
Was this topic helpful?
Document Information
Modified date:
20 January 2020
UID
ibm11126899