News
Abstract
The options panel allows you to set many Performance Data Investigator preferences. Read this page for more details.
Content
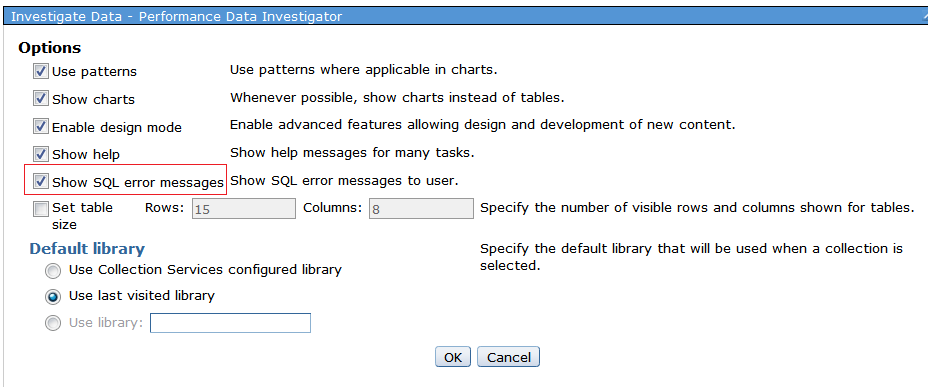
The Options panel allows you to change the following settings for Performance Data Investigator:
- Use patterns
- Show charts (instead of tables)
- Enable design mode
- Show help
- Show SQL error messages (for ModifySQL panel)
- Set table size
- Default Library
- Use the configured library
- Use the last visited library
- Use a specified library
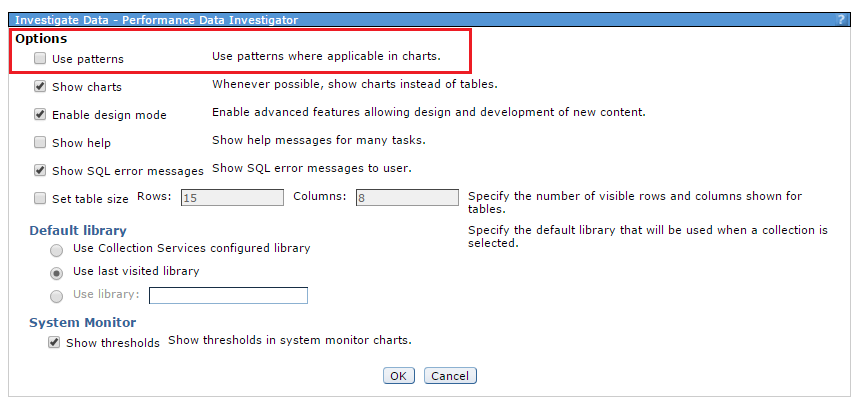
- System Monitor - show thresholds in system monitor charts
There are 2 ways to get to the Options panel and change chart Options:
2- Investigate data collection selection panel from left hand navigation selection of a perspective.
1- Investigate Data panel:
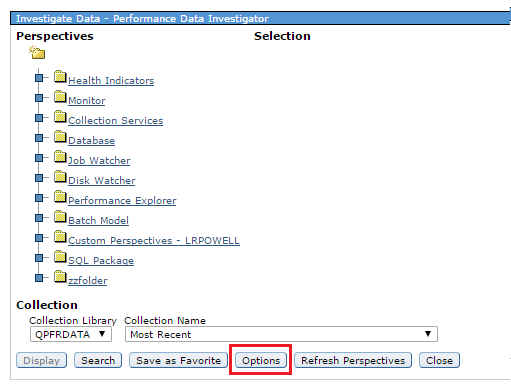
2- Collection selection panel
From using the left hand navigation to select a perspective, you will see the Collection selection panel: 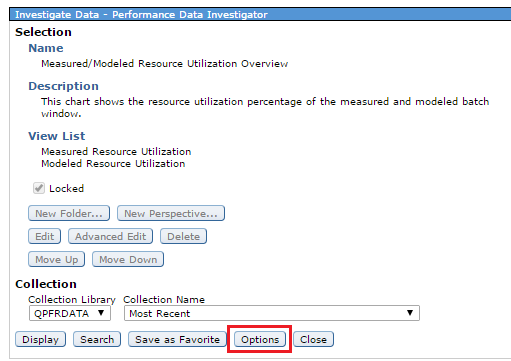
View SQL Error Messages
Checking this box will allow you to see SQL error messages when using the Modify SQL function:
Turn Patterns on/off
Patterns are off by default. To get patterns added to the color charts, you can turn on patterns on the Options panel by checking the "Use patterns" checkbox:
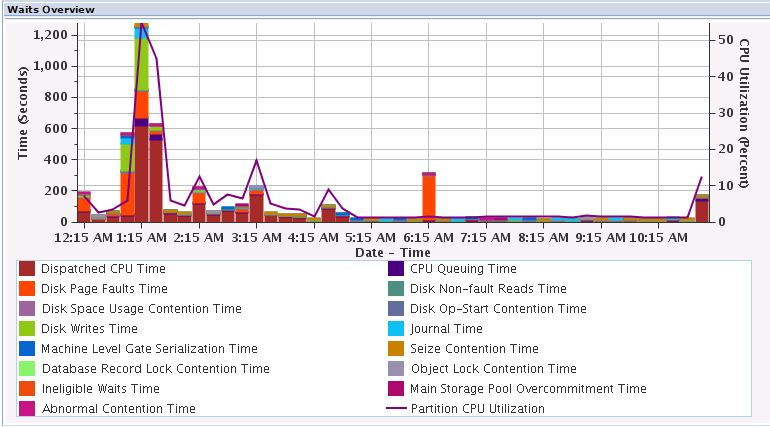
Here is a chart example with no patterns used, only solid colors:
Was this topic helpful?
Document Information
Modified date:
20 January 2020
UID
ibm11126149